Break-even analysis shows how much you need to sell before a product, service, project, or business decision stops losing money. It helps leaders test pricing, costs, sales targets, and risk before committing more time or cash. Used well, it turns a financial calculation into a practical decision tool.
This article explains what break-even analysis is, how to calculate the break-even point, how to use the result in real business decisions, and where this simple calculation can go wrong. I will also show how break-even analysis connects to pricing, cash flow, strategy, AI-era search behaviour, and better decision-making under uncertainty.
I have also included a free Break-Even Decision Calculator so you can test your own numbers rather than just read the formula.
- Break-even analysis shows how much you need to sell before a decision stops losing money.
- It helps test pricing, costs, sales targets, and risk before you commit too much cash.
- The break-even point is not the same as success — it is the point where profit can begin.
- A good break-even calculation should always be checked against real customer demand.
- Used well, break-even analysis becomes a practical decision tool, not just a finance formula.
Why break-even analysis matters more than many leaders think
Break-even analysis can sound like one of those finance topics that belongs in a textbook, a classroom, or a meeting where everyone pretends to understand the spreadsheet.
But used well, it is far more practical than that.
In my experience, break-even analysis is one of the simplest ways to stop a business idea from drifting into wishful thinking.
It helps you test whether a decision is realistic before you spend too much money, time, or energy on it.
That matters because many business decisions sound sensible at first:
“Let’s launch a new service.”
“Let’s hire another person.”
“Let’s lower the price to win more work.”
“Let’s run a new campaign.”
“Let’s buy the equipment now.”
“Let’s expand into another area.”
All of these may be good decisions.
Or they may quietly turn into expensive little monsters.
Break-even analysis gives you an early warning. It does not give you the full answer, but it gives you a useful signal.
And in business, signals matter!
Over time, I’ve found that good decisions rarely come from data alone. They come from understanding people, reading signals, creating the right environment, and thinking beyond the immediate outcome.
Break-even analysis helps with the signal part. It shows whether the sales needed to justify a decision are realistic, risky, or frankly living in fantasy land with a nice spreadsheet.
What is break-even analysis?
Break-even analysis shows how much a business needs to sell to cover its costs before it starts making profit.
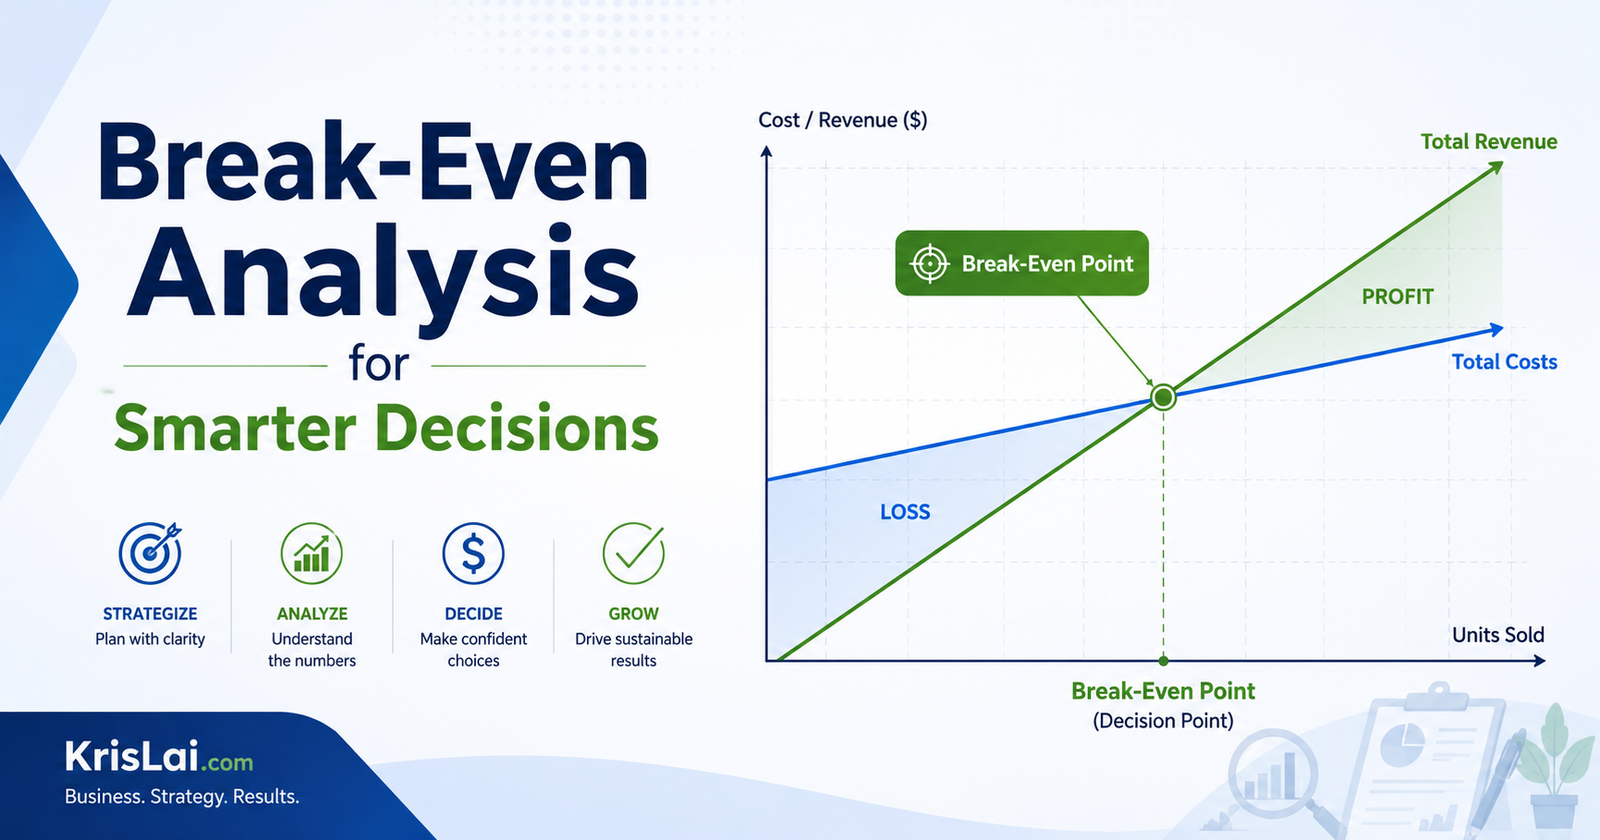
The break-even point is the point where total revenue equals total costs.
At that point, the business is not making a profit.
It is also not making a loss.
It is simply covering its costs.
That may not sound exciting, and to be fair, “zero profit” is not usually the dream. Nobody starts a business to proudly announce, “Good news, we made absolutely nothing!”
But the break-even point is useful because it tells you the minimum level of sales needed before a decision can start to make financial sense.
Break-even analysis shows how many sales, units, jobs, or customers a business needs before total revenue covers total costs.
It answers a simple but powerful question: “How much do we need to sell before this decision starts to make financial sense?”
Useful background reading:
Investopedia: Break-Even Analysis
Federation of Small Businesses: Break-Even Analysis for Small Business
What is the break-even point?
The break-even point is where your sales cover your fixed and variable costs, leaving you with no profit and no loss.
It can be shown in:
units sold
sales revenue
number of jobs
number of customers
number of subscriptions
number of billable hours
number of service visits
For example, if your break-even point is 134 units, you need to sell 134 units before you cover your costs.
If you sell fewer than 134, you lose money.
If you sell more than 134, you can start making profit.
The key word is “start”.
Break-even is not success.
Break-even is the line you cross before success has a chance.
Idea Bridge: from finance calculation to business decision
Many articles explain break-even analysis as a formula.
That is useful.
But it is not enough.
A formula can tell you the sales number.
It cannot tell you whether your customers care enough to buy.
It cannot tell you whether your team has the capacity to deliver.
It cannot tell you whether your price feels fair in the market.
It cannot tell you whether your cash will run out before the break-even point arrives.
This is why I see break-even analysis as part of business decision-making, not just accounting.
I help people make better business decisions through psychology, strategy, and practical thinking. From that point of view, break-even analysis is a simple way to bring financial reality into the room before enthusiasm runs off with the budget.
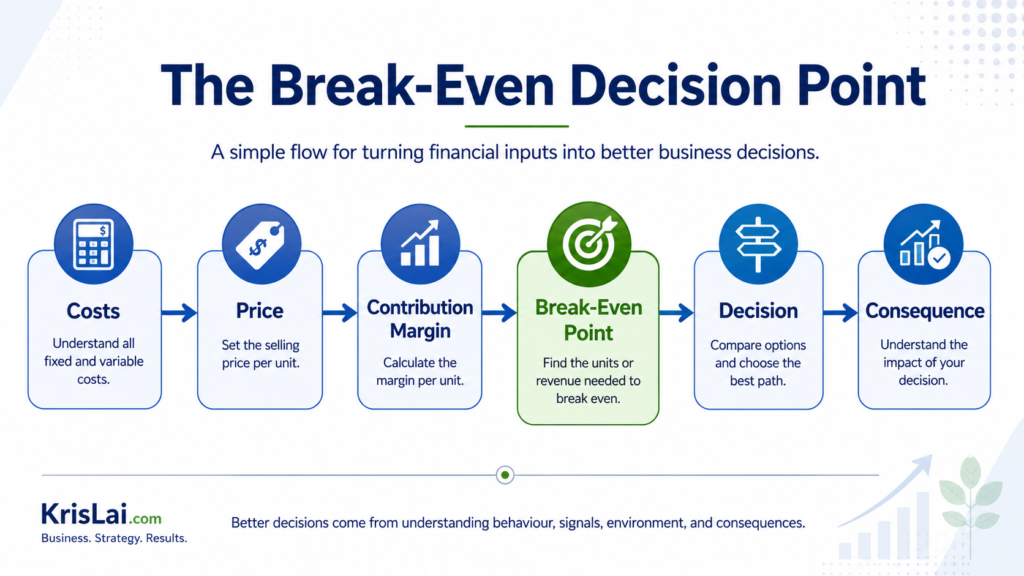
This approach is part of the KrisLai Decision Framework, a practical method for improving business decisions.
Better decisions always come from understanding behaviour, signals, environment, and consequences.
Why is break-even analysis important?
Break-even analysis is important because it helps leaders see whether a business idea, price, project, or investment is financially realistic before they commit too much.
It can help with decisions such as:
Should I launch this new product?
Should I add this new service?
Should I change my price?
Should I hire someone?
Should I buy equipment?
Should I run this marketing campaign?
Should I open another location?
Should I keep this low-margin work?
Should I stop this offer before it drains cash?
That is why break-even analysis for small business owners and managers can be so useful.
It turns vague hope into a clearer question:
Can we realistically sell enough to cover the cost?
That one question can save a business from a lot of pain.
The break-even point is not just a number. It is a reality check. If the sales needed to break even are far beyond what your market can support, the numbers are warning you before customers do.
The KrisLai Decision Framework™ and break-even analysis
Break-even analysis fits neatly into this framework.
Human behaviour asks: Will customers actually buy enough?
Signals ask: What are sales, enquiries, margins, and demand telling us?
Environment asks: Are our costs, capacity, competition, and timing realistic?
Consequences ask: What happens if we miss the break-even point?
This is why break-even analysis should not sit alone in a spreadsheet.
It should be part of a wider decision conversation.
A break-even number is not the decision.
It is a signal that helps you make the decision.
What is the break-even analysis formula?
The break-even analysis formula is fixed costs divided by selling price per unit minus variable cost per unit.
Here is the simple formula:
Break-even point = Fixed costs ÷ (Selling price per unit − Variable cost per unit)
The part in brackets is called contribution margin.
So you can also write it like this:
Break-even point = Fixed costs ÷ Contribution margin
This is the formula most people are looking for when they search for “break-even analysis formula”, “break-even point formula”, or “how to calculate break-even point”.
It looks simple because it is!
The thinking behind it is where the real value sits.
What are fixed costs and variable costs?
Fixed costs stay broadly the same even when sales change, while variable costs rise or fall with each unit sold or service delivered.
This difference matters because many break-even mistakes start when costs are put in the wrong bucket.
Fixed cost examples
Fixed costs may include:
rent
salaries
insurance
software subscriptions
equipment leases
licences
website costs
basic marketing retainers
accountancy fees
office costs
loan repayments
These are costs you usually have to pay whether you sell one unit or one hundred units.
Variable cost examples
Variable costs may include:
materials
packaging
delivery
payment fees
direct labour
stock
sales commission
job-specific supplies
contractor costs
cleaning products for a specific job
fuel for a delivery or site visit
These costs usually rise when you sell more.
In a service business, variable costs can be harder to see. Time, fuel, labour, supplies, and job-specific admin can all matter.
What I’ve seen in many small businesses is that owners often know the big fixed costs but underestimate the smaller variable costs.
The problem is that small costs are like small leaks.
One is annoying.
Many can sink the boat.
Many break-even calculations go wrong because costs are placed in the wrong category, or small costs are ignored completely.
Small costs may look harmless on their own, but together they can quietly turn a “profitable” idea into a loss-making one.
What is contribution margin?
Contribution margin is the amount left from each sale after variable costs are removed.
The formula is:
Contribution margin = Selling price per unit − Variable cost per unit
For example:
Selling price: £50
Variable cost: £20
Contribution margin: £30
That £30 helps cover fixed costs.
After fixed costs are covered, it helps create profit.
Contribution margin is important because it shows how much each sale actually contributes towards covering the business.
This is why revenue can be misleading.
A business can have lots of sales and still struggle if the contribution margin is too low.
Busy is not the same as profitable.
That sentence deserves a chair, a cup of tea, and a permanent place in many business meetings.
Break-even analysis example: a simple worked calculation
Here is a simple break-even analysis example:
Imagine you are considering a new product, service, or offer.
Your numbers are:
Fixed costs: £4,000 per month
Selling price: £50
Variable cost: £20
Contribution per sale: £30
Now use the formula:
Break-even point = Fixed costs ÷ Contribution margin
Break-even point = £4,000 ÷ £30
Break-even point = 133.33
You cannot usually sell 0.33 of a product or service, unless your business model is very strange indeed.
So you round up.
Break-even sales = 134 units
This means you need to sell 134 units per month to cover your costs.
If I can realistically sell 134 units, the idea may be worth testing. If I need 300 units and my current audience can only support 80, the numbers are warning me before the market does.
This is where break-even analysis becomes more than maths. It becomes a business decision signal.
Direct answer: what does this break-even number mean?
The break-even number tells you the minimum sales needed before the idea stops losing money.
If you can realistically sell 134 units, the idea may be worth testing.
If you need to sell 300 units and your current audience can only support 80, the numbers are warning you before the market does.
That is the value of break-even analysis.
It does not guarantee success.
It tells you whether the target is realistic enough to deserve more attention.
How does break-even analysis help decision-making?
Break-even analysis helps decision-making by showing the minimum sales needed before a decision becomes financially viable.
This matters because leaders often make decisions under uncertainty.
You rarely know everything before you act.
You may not know exactly how many customers will buy.
You may not know how competitors will respond.
You may not know whether costs will rise.
You may not know whether AI search tools will change how customers find your offer.
You may not know whether demand will be steady or seasonal.
Break-even analysis does not remove that uncertainty.
But it gives you a clear test.
It helps you ask:
What must be true for this decision to work?
What level of sales do we need?
How realistic is that sales level?
What happens if we fall short?
What signal would make us stop, change, or continue?
That is real business strategy.
Not textbook strategy.
Break-even analysis is most useful when it is linked to a clear decision. The calculation should help you decide whether to launch, pause, test, change the price, reduce costs, or walk away.
The number itself is only the start. The better question is: “What should we do because of this number?”
What this looks like in real business
Imagine a small service business wants to launch a new monthly package…
The owner is excited.
The team is positive.
The offer sounds useful.
The website copy is nearly ready.
The Canva graphic is looking surprisingly professional!
So far, so good.
Then the business runs a break-even analysis.
The fixed costs for admin, promotion, software, and setup come to £4,000 per month.
The selling price is £50.
The variable cost per sale is £20.
The contribution margin is £30.
The break-even point is 134 sales per month.
Now the decision becomes clearer.
The question is no longer:
“Do we like this idea?”
The better question is:
“Can we realistically win, serve, and keep 134 customers per month at this price?”
That is a much stronger business question.
A business idea can sound good and still fail the break-even test. The important question is not only whether the offer is useful, but whether enough people will buy it at the right price and at the right time.
If current demand suggests 150 to 180 sales may be realistic, the idea may be worth testing.
If current demand suggests 30 to 50 sales, the idea may need a different price, lower costs, a smaller test, or a complete rethink.
The break-even point has done its job.
It has turned enthusiasm into a decision.
Break-even analysis for pricing decisions
Break-even analysis helps pricing decisions by showing how different prices change the number of sales needed to cover costs.
Let’s use the same example.
Fixed costs: £4,000
Variable cost per sale: £20
Price option 1: £50
Contribution margin: £30
Break-even point: £4,000 ÷ £30 = 134 units
Now imagine you lower the price to £45.
Price option 2: £45
Variable cost per sale: £20
Contribution margin: £25
Break-even point: £4,000 ÷ £25 = 160 units
At first, lowering the price may feel attractive.
Lower price, more customers, happy days.
Possibly.
But the break-even analysis shows the trade-off.
At £50, you need 134 sales to break even.
At £45, you need 160 sales to break even.
So the real question is:
Will the lower price produce at least 26 extra sales?
If not, the lower price may create more pressure, not more profit.
This is where pricing decisions go wrong. Leaders often look at the customer reaction to the price, but not the sales volume required to make that price work.
A lower price is not always a better decision.
Sometimes it is just a more polite way to work harder for less money.
A lower price can make an offer look more attractive, but it may also increase the number of sales needed to break even.
Sometimes a lower price does not reduce risk. It simply means the business has to work harder to stand still.
Break-even analysis and cash flow: what leaders often miss
Break-even analysis shows when profit starts, but it does not automatically show whether cash will run out before that point.
This is a major point.
A business can look close to break-even on paper but still face cash pressure.
Why?
Because cash timing matters.
Break-even analysis may not fully account for:
customers paying late
stock bought before sales
VAT timing
seasonal demand
loan repayments
upfront setup costs
supplier payment terms
wages paid before customer money arrives
marketing spend before sales convert
This is why break-even analysis should sit alongside cash flow forecasting.
A product or service may break even eventually, but if the cash runs out first, the spreadsheet does not deserve applause.
It deserves a quiet word.
Break-even analysis shows when costs are covered. It does not automatically show whether you have enough cash to survive until that point.
A business can be close to break-even on paper and still run into cash pressure if customers pay late, costs rise early, or stock has to be bought upfront.
Useful related reading:
Cash Flow Forecasting as an Early-Warning Decision Tool
Margin of safety: the space between survival and pressure
Margin of safety shows how far actual sales can fall before the business drops back to break-even.
The formula is:
Margin of safety = Actual sales − Break-even sales
For example:
Break-even sales: 134 units
Actual sales: 180 units
Margin of safety: 46 units
This means sales could fall by 46 units before the business drops back to break-even.
A strong margin of safety gives the business breathing room.
A weak margin of safety means the business is close to pressure.
This matters because business is rarely smooth.
Costs rise.
Customers delay.
Staff leave.
Competitors act.
Search behaviour changes.
AI tools change how people compare suppliers.
A small margin of safety means there is little room for error.
Margin of safety shows how much breathing room the business has. A small margin of safety means one weak month, one cost increase, or one lost customer could put pressure on the decision.
Break-even analysis in a business plan
Break-even analysis in a business plan shows whether the sales target behind the plan is financially realistic.
This is useful for:
start-ups
new product launches
service businesses
funding applications
new locations
pricing changes
equipment purchases
growth plans
But here is the important point.
A break-even figure in a business plan should not be a decorative number placed there to look professional.
It should shape the decision.
If the business plan says you need 500 sales per month, but current demand suggests 80, the plan needs more work.
That is not pessimism.
That is maths politely tapping you on the shoulder.
Cost-volume-profit analysis: where break-even fits
Cost-volume-profit analysis looks at how costs, sales volume, and profit connect.
Break-even analysis is part of this wider idea.
In simple terms:
Cost tells you what must be covered.
Volume tells you how much you need to sell.
Price tells you how much each sale brings in.
Profit tells you what remains.
This can help leaders test different decisions.
For example:
What happens if price rises by 10%?
What happens if variable cost rises by 15%?
What happens if sales are 25% lower than expected?
What happens if fixed costs increase after hiring?
What happens if a new process reduces delivery cost?
This is where break-even analysis becomes more than a one-off calculation.
It becomes a way to test decisions before reality tests them for you.
Reality is a very strict examiner…
Where this goes wrong
Break-even analysis becomes dangerous when leaders treat the calculation as proof that a decision will work.
The formula can show how many sales are needed, but it cannot prove customers will buy, costs will stay stable, or cash will arrive on time.
1. Leaders confuse break-even with success
Break-even means no loss.
It does not mean good profit.
It does not mean strong cash flow.
It does not mean the business model is healthy.
It simply means costs are covered.
A decision that only just breaks even may still be too risky if it uses too much time, attention, stock, energy, or working capital.
2. The sales target is mathematically correct but commercially unrealistic
The formula may say you need 134 sales.
But the market may say 40.
This is where leaders must connect finance with customer behaviour.
If customers are not ready to buy, the break-even point becomes a warning, not a target.
This links closely to customer intent marketing. You need to know whether people are showing real buying signals, not just polite interest.
Useful related reading:
Customer Intent Marketing: How to Turn Buying Signals Into Sales
3. Costs are underestimated
This is very common.
The obvious costs are included.
The annoying small costs are ignored.
Then the business wonders why the numbers do not work.
Costs that are often missed include:
delivery
returns
payment fees
admin time
software
training
support
travel
waste
maintenance
customer service
management time
In my experience, many businesses do not lose money because they forgot the big cost.
They lose money because they ignored the small ones repeatedly.
4. Time is ignored
A business may be able to break even eventually.
But can it survive until then?
This is where cash flow matters.
If you spend now but customers pay later, the business may face pressure even if the idea is profitable on paper.
Break-even analysis answers one question.
Cash flow forecasting answers another.
You need both.
5. Demand is assumed, not tested
Break-even analysis tells you what needs to happen.
It does not prove customers will buy.
This is a vital difference.
If you need 134 monthly sales, you should test whether that level of demand is realistic.
Use:
customer interviews
search behaviour
enquiry data
conversion rates
pilot offers
waiting lists
small campaigns
sales calls
AI search visibility checks
customer intent signals
This is where micro-moment marketing matters. A customer may show intent in small moments: a search, a question, a comparison, a pricing enquiry, or a repeat visit.
Useful related reading:
Micro-Moment Marketing: How Small Moments Drive Big Buying Decisions
6. The model is not updated
Old costs and old prices create false comfort.
Break-even analysis should be updated when:
costs rise
prices change
demand shifts
delivery time changes
staffing changes
suppliers change
competition changes
customer behaviour changes
AI search changes how people discover and compare options
A break-even model is not something you create once and then admire forever.
It is a working tool.
What are the limitations of break-even analysis?
Break-even analysis is useful, but it depends on assumptions about price, cost, demand, sales volume, and time.
Its main limitations are:
It assumes costs are fairly predictable.
It assumes prices stay stable.
It assumes customers will buy enough.
It can oversimplify businesses with many products or services.
It does not fully show cash timing.
It does not include competitor behaviour.
It does not fully account for changing customer demand.
It does not replace cash flow forecasting.
It may ignore capacity limits.
It may make a risky decision look cleaner than it is.
Unit4’s guide also highlights important limitations such as demand uncertainty, static cost assumptions, and the need to combine break-even analysis with scenario modelling and wider planning.
Useful background reading:
Unit4: Break-Even Analysis Guide, Benefits and Limitations
The point is simple.
Break-even analysis is a good tool.
It is not a magic wand.
And as we all know, business magic wands are usually sold by people who also have a course to sell.
Break-even analysis depends on assumptions. If the assumptions are weak, the answer will also be weak.
That is why the calculation should be tested against customer demand, cash flow, capacity, competition, and changing market conditions.
How to lower your break-even point
You can lower your break-even point by reducing fixed costs, reducing variable costs, increasing contribution margin, improving pricing, or focusing on higher-value sales.
Here are practical ways to do it.
Reduce fixed costs
Review:
rent
software
subscriptions
insurance
unused tools
retainers
equipment leases
standing charges
But be careful.
Cutting useful costs can damage the business.
The goal is not to become cheap.
The goal is to remove waste.
Reduce variable costs
Look at:
supplier prices
delivery costs
payment fees
materials
packaging
job-specific labour
rework
waste
process delays
This connects with lean management. Small process improvements can reduce the cost of each sale.
Increase contribution margin
You can increase contribution margin by:
raising prices carefully
reducing delivery cost
selling higher-value packages
reducing low-margin work
bundling services
improving conversion
focusing on better-fit customers
Sometimes the issue is not that the business needs more sales.
Sometimes it needs better sales.
Busy work can hide weak margins.
Improve customer targeting
A business may lower its break-even pressure by focusing on customers who value the offer more.
This is where behavioural insight matters.
Not every customer is equally profitable.
Not every enquiry is equally useful.
Not every sale is worth chasing.
A business that understands customer intent can avoid wasting time on low-fit customers.
Lowering the break-even point is not only about cutting costs. It can also mean improving the quality of sales, serving better-fit customers, reducing waste, or increasing the value of each transaction.
The aim is not to become cheaper. The aim is to make the business model stronger.
Should you use a break-even calculator or Excel?
A break-even calculator is useful for quick checks, while Excel or Google Sheets is better for testing different prices, costs, and sales scenarios.
Use a break-even calculator when you want a quick answer.
Use Excel or Google Sheets when you want to test:
different price points
higher costs
lower sales
different contribution margins
best-case and worst-case scenarios
monthly changes
cash flow timing
This is where AI can also help.
AI tools can help you build a simple break-even table, test assumptions, and create cautious, expected, and optimistic scenarios.
But do not let AI replace your judgement.
AI can help with the structure.
You still need to check the numbers.
A beautifully formatted wrong answer is still wrong.
Break-even analysis and AI-era decision-making
AI is changing how people search, compare, and make decisions.
Customers may ask tools like ChatGPT, Gemini, Perplexity, Claude, or Google AI Overviews to compare options before visiting your website.
That means businesses need to understand whether customer demand is visible in new ways.
For break-even analysis, this matters because demand assumptions are changing.
A business should ask:
Are people still searching for this problem?
Are they asking AI tools for comparisons?
Are they comparing price, trust, reviews, and proof before contacting us?
Are we visible when customers ask decision-stage questions?
Are we answering the questions that buyers need before they act?
Break-even analysis tells you how many sales you need.
Search behaviour and customer intent signals help you judge whether those sales are likely.
This is why the future of search matters for business decisions.
If your break-even point depends on customer demand, you need to understand how customers now find, compare, and choose.
Use break-even analysis before making decisions that increase costs, change prices, add capacity, or depend on uncertain sales.
It is especially useful before launching a product, adding a service, hiring staff, buying equipment, or running a paid campaign.
A simple 7-step break-even decision process
Here is a simple process you can use before making a financial decision:
Step 1: Name the decision
Ask:
What are we actually deciding?
Are you deciding whether to launch, test, spend, hire, expand, change price, or stop?
A clear decision is easier to test.
A vague decision lets assumptions hide.
Step 2: List fixed costs
Ask:
What costs will we carry even if sales are low?
Be honest.
Do not leave out costs because they are awkward.
Awkward costs have a habit of becoming very real later.
Step 3: Estimate variable cost per unit
Ask:
What does each sale, job, product, or customer cost to deliver?
Include the real cost of delivery.
Time counts.
Labour counts.
Materials count.
Support counts.
Travel counts.
Admin counts.
Step 4: Set a realistic selling price
Ask:
What will customers actually pay?
Not what would be lovely.
Not what competitors charge if your offer is different.
Not what makes the spreadsheet look cheerful.
What will your real target customer pay?
Step 5: Calculate contribution margin
Subtract variable cost from selling price.
This shows what each sale contributes towards fixed costs and profit.
Step 6: Calculate the break-even point
Divide fixed costs by contribution margin.
This gives the number of sales, units, jobs, or customers needed to break even.
Step 7: Decide what the number is telling you
This is the most important step.
Ask:
Is the break-even point realistic?
Is it risky but testable?
Is it unrealistic?
Should we change price?
Should we reduce costs?
Should we test demand first?
Should we start smaller?
Should we walk away?
This final step turns the calculation into a decision.
Want to test your own numbers? Download the free KrisLai Break-Even Decision Calculator.
Use it to check fixed costs, variable costs, selling price, contribution margin, break-even sales, pricing scenarios, and whether a business decision is realistic, risky, or unrealistic.
Download the free calculator here
(If the above link doesn’t work, you can also get it here.)
Break-even decision checklist
Before making an important business decision, ask:
What is the break-even point?
Can we realistically reach it?
How long will it take?
What cash do we need before then?
What if the price drops?
What if costs rise?
What if sales are 25% lower than expected?
What is our margin of safety?
What is the best-case, expected, and cautious scenario?
What customer behaviour supports the sales target?
What signal tells us to stop, change, or continue?
What is the consequence if we are wrong?
This checklist is simple on purpose.
A useful checklist beats a perfect model that nobody uses.
The best break-even question is not “What is the number?” It is “What does this number tell us to do next?”
Break-even analysis table for business decisions
| Decision | What break-even analysis shows | What it does not show |
|---|
| Launch a product | Sales needed to cover costs | Whether customers will buy |
| Change price | Sales volume needed at each price | Brand impact or customer trust |
| Hire staff | Extra sales needed to cover wages | Whether the hire improves quality |
| Buy equipment | Sales needed to justify the cost | Cash timing and maintenance risk |
| Run a campaign | Leads or sales needed to pay back spend | Lead quality or customer intent |
| Add a service | Jobs needed to cover delivery costs | Whether the team has capacity |
| Expand location | Revenue needed to cover new fixed costs | Whether local demand is strong enough |
KrisLai Decision Insight
This connects closely to how I think about decisions more broadly in the KrisLai Decision Framework™.
Break-even analysis helps leaders think through:
Behaviour: Will customers buy enough at this price?
Signals: What do enquiries, conversion rates, margins, and search behaviour show?
Environment: Are costs, capacity, timing, and competition realistic?
Consequences: What happens if the break-even target is missed?
That is the real value.
The calculation matters.
But the decision around the calculation matters more.
I write about how better decisions are made in business — combining strategy, behaviour, and practical thinking. Break-even analysis is one of those simple tools that can make thinking clearer before money is committed.
FAQ
What is break-even analysis in simple terms?
Break-even analysis shows how much a business needs to sell to cover its costs before it starts making profit.
What is the break-even point?
The break-even point is where total revenue equals total costs. At this point, the business is not making a profit or a loss.
What is the break-even analysis formula?
The formula is fixed costs divided by selling price per unit minus variable cost per unit.
How do you calculate break-even point?
Subtract variable cost per unit from selling price per unit to get contribution margin. Then divide fixed costs by contribution margin.
What is contribution margin?
Contribution margin is the amount left from each sale after variable costs are removed. It helps cover fixed costs and then contributes to profit.
Why is break-even analysis important?
Break-even analysis is important because it helps leaders set prices, test ideas, plan sales targets, control costs, and understand whether a decision is financially realistic.
What are the limitations of break-even analysis?
Break-even analysis relies on assumptions about costs, prices, demand, and time. It does not prove that customers will buy, and it should be used with cash flow forecasting and market insight.
How does break-even analysis help pricing decisions?
Break-even analysis helps pricing decisions by showing how price changes affect the number of sales needed to cover costs.
How can a business lower its break-even point?
A business can lower its break-even point by reducing costs, improving margins, raising prices carefully, improving efficiency, or focusing on more profitable customers.
Is break-even analysis useful for service businesses?
Yes. Service businesses can use break-even analysis by calculating the sales revenue or number of jobs needed to cover fixed and variable costs.
Should break-even analysis be used with cash flow forecasting?
Yes. Break-even analysis shows when costs are covered, while cash flow forecasting shows whether the business has enough cash to survive before and after that point.
Research and experience note
This article is based on practical experience, independent research, and analysis of how break-even analysis is used in real business decisions.
Useful reference sources include:
Investopedia: Break-Even Analysis
Federation of Small Businesses: Break-Even Analysis for Small Business
Unit4: Break-Even Analysis Guide
Yale School of Management: A Primer on Breakeven Analysis
The aim is not to make break-even analysis more complicated.
The aim is to make it more useful.
Break-even analysis helps leaders test whether a decision is financially realistic. It works best when combined with customer behaviour, market signals, cash flow, and second-order thinking.
This connects closely to the KrisLai Decision Framework™: behaviour, signals, environment, and consequences.
This article connects to a wider set of questions about strategy, uncertainty, and better judgement. If you want to think more clearly about business decisions, these articles are a good next step.
Final thought: if you remember nothing else
If you remember nothing else, remember this:
Start with this one thing: before launching, pricing, hiring, buying, or expanding, calculate the break-even point and then ask, “Can we realistically reach this number?”
That question is small.
But it can protect you from poor pricing, weak offers, overconfident forecasts, and expensive assumptions.
Break-even analysis will not make every decision easy.
But it will make many decisions clearer.
And clarity is valuable when business feels uncertain.
Better decisions come from understanding behaviour, signals, environment, and consequences.
If you are unsure where to start, download the free Break-Even Decision Calculator and test one decision: a price change, new service, campaign, hire, or equipment purchase.
If you want to strengthen how you make decisions under pressure, I’ve put together a free guide to The KrisLai Decision Framework™ — a practical way to spot signals early and act more clearly.
Free Guide: Better Business Decisions Under Pressure
Financial pressure rarely begins with one dramatic event. It usually starts with small signals that are easy to miss.
Enter your email below and I’ll send you the free KrisLai Decision Framework™ guide, a practical model for understanding behaviour, signals, environment, and consequences before problems become more expensive.
It is designed to help leaders think more clearly and act earlier when timing, pressure, and uncertainty begin to build.
If you enjoy exploring the ideas behind better business decisions, you may find the Business Thinking Hub useful.
About the author
Kris Lai is a business operator and managing director with experience in land and building surveying, facilities management, logistics, and service delivery.
Earlier in his career, he worked as a Search Engine Evaluator (via Lionbridge, supporting Google), where he assessed search result relevance, user intent, and content quality using structured evaluation frameworks. This experience gives him a rare, practical understanding of how search systems interpret signals and make ranking decisions.
In parallel, whilst working with a charity organisation, he has delivered 1000’s of structured presentations in English, Finnish, and Chinese to audiences ranging from small groups to more than 600 people, and has spent decades mentoring and developing others. This experience informs his approach to clarity, communication, and decision-making under pressure.
He writes about AI, search behaviour, business strategy, and decision-making from a practical, real-world perspective.
👉 Explore ideas connected to better business decisions:
- How AI Is Changing Search Behaviour (And What Businesses Must Do Now)
- Decision-Making Framework Examples: The KrisLai Method in Action
- The KrisLai Decision Framework: A Better Way to Make Business Decisions
- Micro vs Macro Marketing: When to Target Broad Audiences vs Niche Customers
- Customer Intent Marketing: How to Turn Buying Signals Into Sales
Similar Posts
Negotiation Skills in Business: BATNA, ZOPA, Real Scenarios, and Better Outcomes
Learn how to improve negotiation skills in business with BATNA, ZOPA, real-world examples, pricing and scope trade-offs, emotional intelligence, and practical strategies for better outcomes.
Crisis Management: How Leaders Make Better Decisions Under Pressure
Crisis management is not only about having a plan. It is about making clear decisions when time is short, information is incomplete, and trust is at risk. Learn how leaders can prepare, respond, communicate, recover, and improve after a crisis.
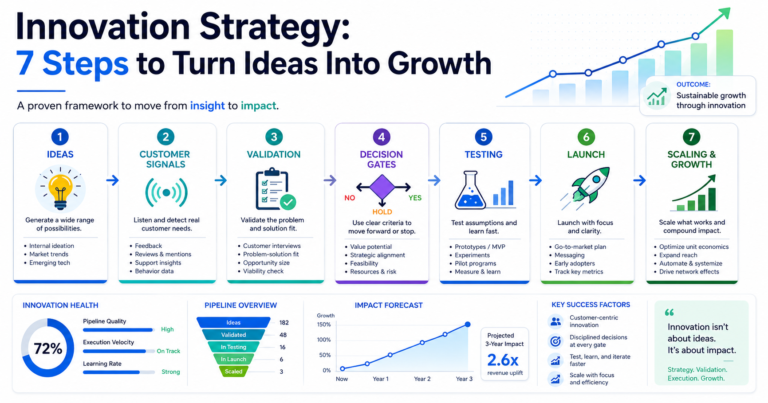
Innovation Strategy: 7 Steps to Turn Ideas Into Growth
Innovation strategy helps businesses decide which ideas to create, test, fund, launch, improve, stop, or scale. This article explains how leaders can use customer signals, idea validation, decision gates, AI-era search behaviour, and practical testing to turn useful ideas into growth without wasting time, money, or attention.
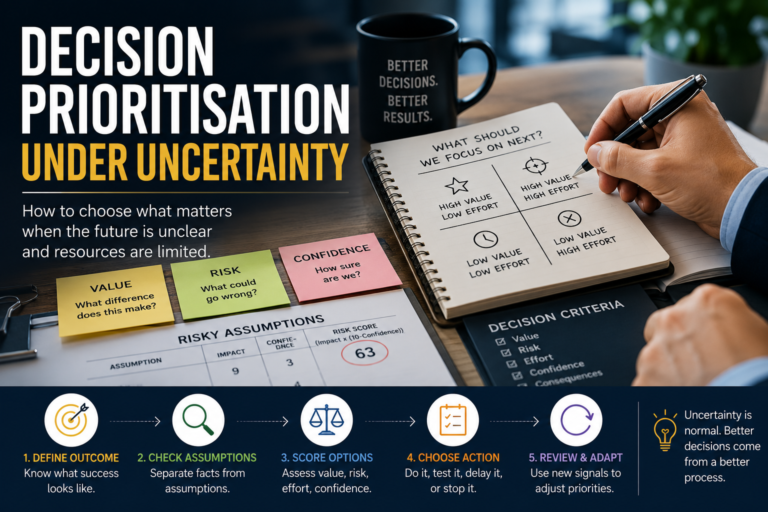
Decision Prioritisation: How to Choose What Matters When the Future Is Unclear
Learn how decision prioritisation helps you rank choices by value, risk, effort, confidence, and consequences when time is limited and the future is unclear.
Why You’re Always Tired at Work (And What to Do About It)
Tired at work every day? Understand the hidden causes of work fatigue and burnout, and discover practical steps to restore energy and productivity.