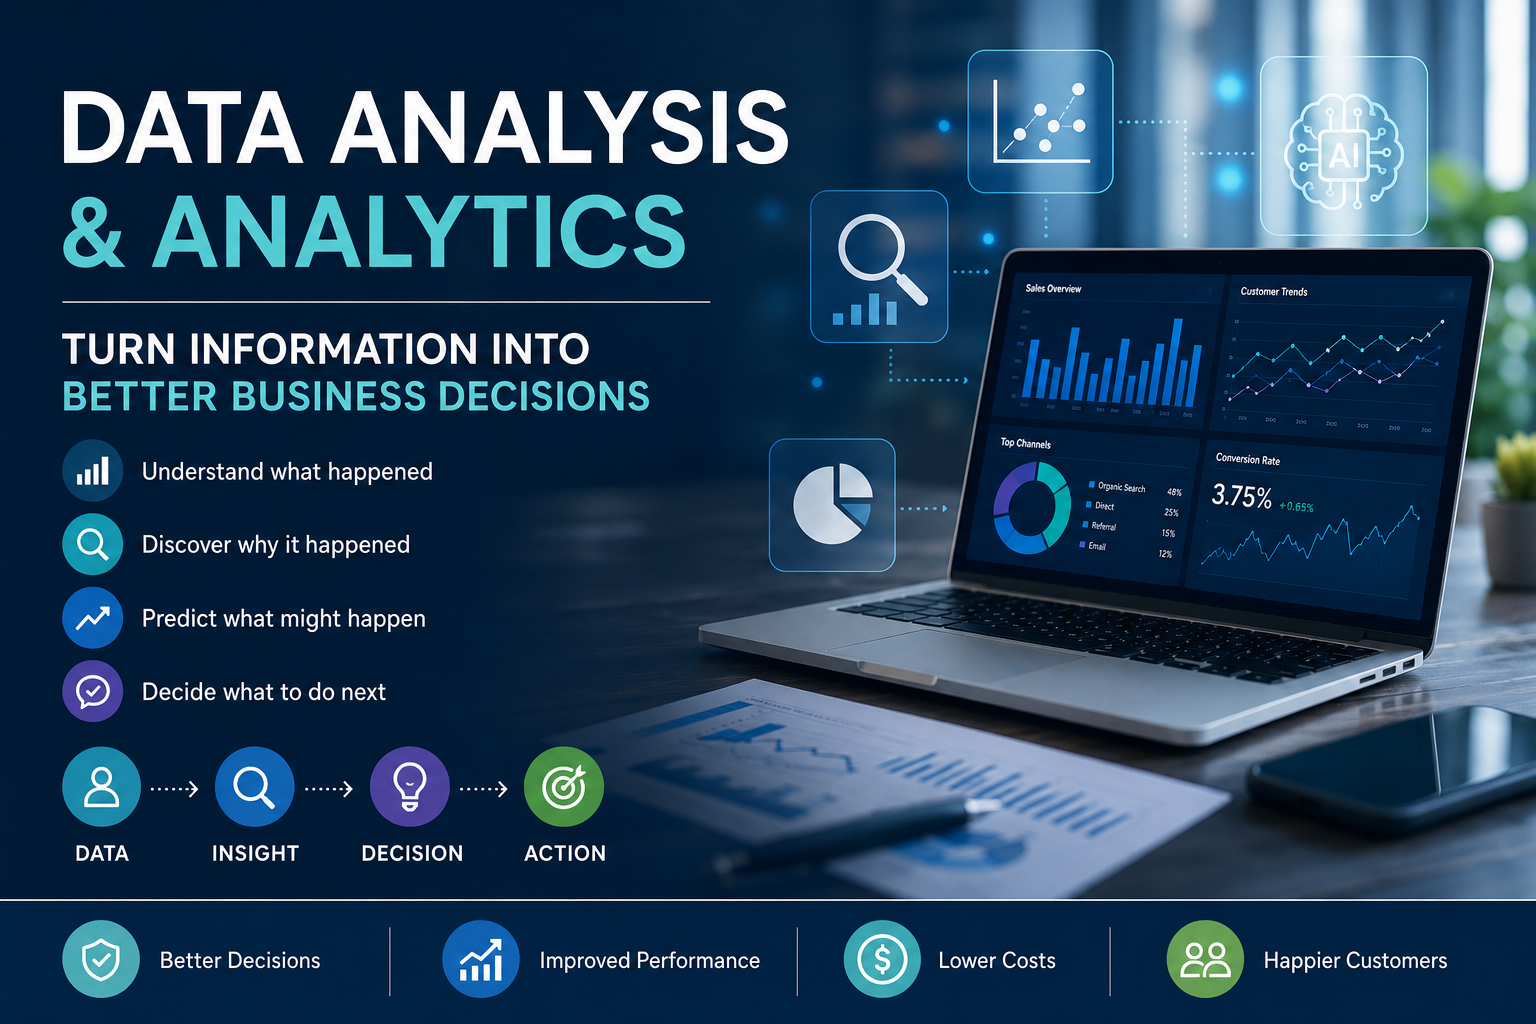
Data analysis and analytics help businesses turn raw information into clearer decisions. Analysis explains what happened and why. Analytics uses data more broadly to guide action, spot patterns, and support future decisions. This guide explains the difference, the main types, the process, tools, mistakes, and real business uses.
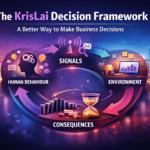
KrisLai Decision Framework™ note: I often think about decisions using a simple model: behaviour, signals, environment, and consequences. This connects closely to how I think about better business decisions more broadly.
Disclosure: If you click on my affiliate/advertiser’s links, I may receive a tiny commission. AND… Most of the time, you will receive an offer of some kind. It’ s a Win/Win!
What this article covers
In this article, I explain what data analysis and analytics mean, how they differ, how raw data becomes useful insight, what the main types of data analysis are, which tools and skills matter, and how businesses can use analytics to make better decisions.
© captainvector, 123RF Free Images
I will also cover common mistakes, AI’s role in analytics, and why data only becomes valuable when it improves what people actually do next.
This article is based on practical business experience, independent research, and my own analysis and synthesis of how data, behaviour, signals, AI, and decision-making affect real business outcomes.
Data does not become valuable just because it is collected.
It becomes valuable when it helps someone make a better decision.
That is where many businesses go wrong!
They collect numbers. They build dashboards. They track website traffic, sales, clicks, costs, enquiries, complaints, reviews, stock levels, productivity, and customer behaviour.
Then they call it “insight”.
But data is not insight by itself.
A dashboard is not a decision.
A report is not a strategy.
A chart is not action.
In real business, data is a signal.
It tells you something may be happening. It does not always tell you the full story. You still need judgement, context, and a clear question.
That is why data analysis and analytics matter.
Used well, they help you see patterns, test assumptions, understand behaviour, reduce guesswork, and decide what to do next.
Used badly, they can make weak thinking look scientific.
Better decisions come from understanding behaviour, signals, environment, and consequences.
I write about how better decisions are made in business — combining strategy, behaviour, and practical thinking.
Key ideas
- Data only creates value when it improves a decision.
- Reporting shows what happened. Analysis helps explain why it happened.
- Analytics uses data more broadly to guide future action.
- Clean data and clear questions matter more than fancy tools.
- AI can speed up analysis, but it cannot replace business judgement.

What is data analysis and analytics?
Data analysis is the process of examining data to find patterns, trends, explanations, and answers. Data analytics is the broader use of data, tools, processes, and methods to support decisions, improve performance, and sometimes predict what may happen next.
In simple terms:
Data analysis looks closely at data.
Data analytics uses data to support better action.
The two terms are often used together, and sometimes people use them almost interchangeably. That is understandable, because they overlap.
But there is a useful difference.
Data analysis often focuses on examining information to understand what happened and why.
Data analytics is often used more broadly to describe the full process of collecting, organising, analysing, interpreting, and using data to guide decisions.
Syracuse University explains the difference in a useful way: data analysis is often focused on examining data to understand past trends, while data analytics uses data to make predictions and guide future decisions.
Data analysis and analytics, in simple terms
Data analysis examines information to find patterns, trends, and explanations. Data analytics is the wider use of data, tools, and methods to support better decisions, improve performance, and guide future action.
What is the difference between data analysis and data analytics?
A practical way to remember it is this:
Data analysis asks:
“What does this data show?”
Data analytics asks:
“How can we use this data to make a better decision?”
For example, imagine your website traffic dropped last month.
Data analysis might show:
- traffic fell by 22%
- mobile visitors dropped most
- one landing page lost ranking
- bounce rate increased
- paid traffic stayed stable
- organic traffic fell
Analytics might then help you decide:
- which page to improve first
- whether a technical SEO issue exists
- whether customer search behaviour changed
- whether AI search results are affecting clicks
- whether content needs updating
- which action should be tested next
That is the real business value.
Not just seeing the drop.
Understanding what to do about it.
What is the difference between reporting, analysis, and analytics?
These three terms are related, but they do different jobs.
Reporting shows what happened.
For example:
“Sales were £40,000 last month.”
Analysis helps explain why it happened.
For example:
“Sales fell because repeat purchases dropped, while new customer orders stayed stable.”
Analytics helps decide what to do next.
For example:
“We should focus on retention emails, customer feedback, and service follow-up because the issue appears to be repeat buying, not first-time demand.”
This distinction matters because many businesses confuse reporting with insight.
A report may show a number.
But analysis asks what the number means.
Analytics asks what action should follow.
Develop a strong foundation in Python programming for AI, utilizing tools like NumPy, pandas, and Matplotlib for data analysis and visualization. Learn how to use, build, and train machine learning models with popular Python libraries. Implement neural networks using PyTorch. Gain practical experience with deep learning frameworks by applying your skills through hands-on projects. Explore generative AI with Transformer neural networks, learn to build, train, and deploy them with PyTorch, and leverage pre-trained models for natural language processing tasks. Designed for individuals with basic programming experience, this program prepares you for advanced studies in AI and machine learning, equipping you with the skills to begin a career in AI programming. Click HERE to get started NOW.
How does data turn into useful insight?
Data becomes useful when it moves through a simple chain:
Raw data → cleaned data → pattern → insight → decision → action → result
Let us use a simple example.
A business collects customer feedback.
At first, it is just raw data:
- emails
- reviews
- survey answers
- support tickets
- complaints
- comments from calls
After cleaning and grouping the data, a pattern appears.
Many customers mention slow response times.
That becomes an insight:
“Customers are not mainly unhappy with the product. They are unhappy with how long it takes to get help.”
Then the decision becomes practical:
“Should we improve support response times before spending more money on new customer acquisition?”
That is how data becomes useful.
It moves from information to action.

What are the main types of data analysis?
The main types of data analysis are descriptive, diagnostic, predictive, and prescriptive. In simple terms, they help you understand what happened, why it happened, what might happen next, and what action could be taken.
This four-part structure is commonly used in business analytics because it helps people understand the maturity of their data work.
You do not need to use complicated language to understand it.
Each type answers a different question.
The four common types of data analysis
- Descriptive – what happened?
- Diagnostic – why did it happen?
- Predictive – what might happen next?
- Prescriptive – what should we do about it?
Descriptive analysis: what happened?
Descriptive analysis summarises past data.
It tells you what has already happened.
Examples include:
- total sales
- website visits
- monthly revenue
- number of complaints
- average order value
- number of new customers
- percentage of repeat buyers
- stock sold by product type
- delivery times by month
This is often the starting point for data work.
For example:
“Website traffic increased by 18% last quarter.”
That is useful.
But it is not the full answer.
Descriptive analysis gives you the first signal.
It does not always explain the cause.
Diagnostic analysis: why did it happen?
Diagnostic analysis digs deeper.
It asks why the result changed.
For example, if sales dropped, diagnostic analysis might look at:
- product category
- customer type
- marketing channel
- pricing changes
- stock availability
- competitor behaviour
- seasonality
- website performance
- customer complaints
- sales team activity
This is where analysis becomes more useful.
Instead of saying:
“Sales are down.”
You can ask:
“Which sales are down, from which customers, through which channel, and what changed before the drop?”
That is a much better business question.
Predictive analytics: what might happen next?
Predictive analytics uses patterns in past and current data to estimate what may happen in the future.
Examples include:
- likely sales demand
- customer churn risk
- stock requirements
- seasonal traffic changes
- cash flow forecasts
- staffing needs
- customer lifetime value
- likely delivery delays
A simple example:
If a business sees that demand rises every year before a certain season, predictive analytics can help estimate how much stock may be needed next time.
Predictive analytics does not guarantee the future.
It gives a more informed view of what might happen.
That is useful, but it should still be treated with judgement.
Prescriptive analytics: what should we do about it?
Prescriptive analytics goes one step further.
It suggests possible actions.
For example:
- increase stock before demand rises
- contact high-risk customers before they leave
- adjust pricing based on margin and demand
- shift budget to better-performing channels
- reduce bottlenecks in a process
- prioritise one customer segment over another
This is where analytics connects most clearly to decision-making.
But there is a warning:
A recommendation is only as good as the data, assumptions, and context behind it.
If the data is weak, the recommendation may be weak too.

How does the data analysis process work?
The data analysis process usually starts with a clear question, then moves through collecting data, cleaning it, checking quality, looking for patterns, testing assumptions, explaining findings, and turning the insight into action.
The process does not need to feel intimidating.
For most business situations, it can be kept simple.
Start with a question that matters
Good data work starts with a good question.
Not:
“Let’s look at the data.”
That is too vague.
A better question is specific.
For example:
- Why are sales falling?
- Which customers are most likely to leave?
- Which service creates the most complaints?
- Which marketing channel brings valuable leads?
- Which process creates the most delay?
- Which product has the best margin?
- Which pages on the website help people decide?
- Which enquiries turn into profitable customers?
This matters because data analysis without a clear question can become wandering.
You look at charts. You find interesting facts. You produce a report.
But nothing changes.
A good question gives the analysis a job.
Collect the right data, not just more data
More data is not always better.
The right data is better.
Depending on the question, you may need:
- sales data
- customer data
- website data
- marketing data
- finance data
- operational data
- stock data
- survey data
- review data
- support tickets
- staff feedback
- competitor information
- external market data
If the question is about customer retention, website traffic alone may not be enough.
If the question is about profitability, sales volume alone may mislead you.
If the question is about service quality, customer complaints may only show part of the picture.
Choose data that matches the decision.
Clean and check the data before trusting it
This is not glamorous, but it is essential.
Data quality matters!
Before analysis, check for:
- duplicates
- missing values
- wrong dates
- inconsistent labels
- old records
- incomplete fields
- incorrect categories
- outliers
- biased samples
- different systems using different definitions
For example, one system might define a “lead” as anyone who filled in a form.
Another might define a lead as someone who had a qualified sales conversation.
If those definitions are mixed, the analysis may be misleading.
This is why data quality matters more than fancy tools.
Poor data can lead to confident but wrong decisions.
Look for patterns and test assumptions
Once the data is clean enough to use, look for patterns.
Ask:
- what changed?
- when did it change?
- which group changed most?
- what stayed the same?
- what looks unusual?
- what trend is repeating?
- what result surprised us?
- what might explain this?
- what assumption are we making?
This is where curiosity matters.
A good analyst does not just collect numbers.
They ask better questions of the numbers.
Share the finding in a way people can act on
A useful finding should be clear.
Do not bury the main point under too many charts.
A strong finding says:
- what was found
- why it matters
- how confident we are
- what decision it affects
- what action is recommended
- what should be checked next
For example:
“Repeat customers are spending less, mainly in the higher-margin service category. This started after the price change in March. We should review customer feedback, compare competitor pricing, and test a retention offer before increasing acquisition spend.”
That is useful.
It connects data to action.

What skills and tools make data analysis useful?
Useful data analysis depends on both human skills and software tools. The strongest analysts ask good questions, think critically, check data quality, understand context, communicate clearly, and use tools such as spreadsheets, dashboards, SQL, Python, R, and visualisation software.
Tools matter.
But tools are not the whole answer.
A person with strong judgement and a spreadsheet can often produce more useful insight than someone using advanced software without a clear question.
The skills behind strong analysis
Strong data analysis needs:
- critical thinking
- curiosity
- attention to detail
- basic statistics
- business understanding
- communication
- ethical judgement
- patience
- clear writing
- the ability to ask better questions
Critical thinking matters because data can be interpreted in different ways.
Curiosity matters because the first answer is not always the right one.
Communication matters because an insight that nobody understands will not change anything.
Business understanding matters because numbers need context.

Image by rawpixel.com on Freepik
Common tools used in data work
Common data tools include:
Spreadsheets
Useful for sorting, cleaning, calculating, and reviewing smaller datasets.
SQL
Used to query databases and extract specific data.
Dashboards
Used to track key metrics visually.
Power BI and Tableau
Used for business intelligence, dashboards, and data visualisation.
Python and R
Used for more advanced analysis, modelling, automation, and statistics.
Databases
Used to store and manage structured data.
AI tools
Used to summarise data, draft queries, explain patterns, generate hypotheses, and help communicate findings.
The best tool depends on the question, the data, the team, and the decision.
Not every business needs advanced analytics software immediately.
Sometimes a well-kept spreadsheet and a disciplined monthly review are a much better starting point.
Why data quality matters more than fancy tools
A bad question with beautiful software is still a bad question.
A poor dataset in an expensive dashboard is still poor data.
A weak assumption in an AI-generated summary is still a weak assumption.
This is where businesses can fool themselves.
A chart looks professional, so people trust it.
A dashboard updates automatically, so people assume it is right.
An AI tool gives a confident answer, so people stop checking.
That is dangerous!
Where this goes wrong
Data analysis goes wrong when people trust the chart before they understand the question, the data, or the context. A dashboard can look impressive and still point people toward the wrong decision if the data is poor or the metric does not match the goal.
Klaviyo – The top email & SMS marketing choice for e-commerce brands
Klaviyo (CLAY-vee-oh) powers smarter digital relationships, making it easy for businesses to capture, store, analyze, and predictively use their own data to drive measurable, high-value outcomes.
Klaviyo’s modern and intuitive SaaS platform enables business users of any skill level to harness their first-party data from more than 350 integrations to send the right message at the right time across email, SMS, and push notifications.
Innovative businesses like Marine Layer, Jones Road, Andie Swim, True Classic and more than 146,000 other paying customers leverage Klaviyo to acquire, engage, and retain customers—and grow on their own terms.
Key features of Klaviyo include:
Klaviyo Email: The top email marketing choice for ecommerce brands
Klaviyo SMS: Send smarter, make more
Klaviyo Reviews: Built-in reviews that make everything smarter
Klaviyo Mobile Push: Free notifications that keep users coming back
Klaviyo Customer Data Platform (CDP): The smarter, easier CDP built for faster results
Klaviyo AI: Your Guide to Smarter Digital Relationships
Want to learn more about how it works? We encourage you to check Klaviyo’s website for more details and get useful information to enrich your content.
How do businesses use analytics to make better decisions?
Businesses use analytics to make better decisions by measuring what is happening, understanding why it is happening, spotting patterns, testing assumptions, and choosing actions that improve results across marketing, sales, operations, finance, customer service, and leadership.
The most useful analytics work is not abstract.
It helps real teams make better choices.
Marketing analytics examples
Marketing analytics can help businesses understand:
- which campaigns bring useful leads
- which content attracts the right audience
- which search terms show customer intent
- which pages help people decide
- which channels waste money
- which messages convert better
- which audiences engage but do not buy
For example, website traffic may look strong.
But if traffic does not turn into enquiries, calls, sales, email sign-ups, or trust-building actions, the business needs to look deeper.
This connects closely to customer intent marketing, where buying signals reveal when customers are closer to making decisions.
A click is not always intent.
A long visit is not always trust.
A search query may reveal more than a pageview.
The job of analytics is to help separate noise from useful signals.
Sales analytics examples
Sales analytics can help teams understand:
- sales trends
- conversion rates
- average order value
- win rates
- lost deal reasons
- repeat purchase behaviour
- customer segments
- pipeline health
- sales cycle length
- high-value customer types
For example, if enquiries are rising but sales are flat, the problem may not be marketing volume.
It may be lead quality, follow-up speed, pricing, trust, offer fit, or sales conversation quality.
Analytics helps ask the better question.
Operations analytics examples
Operations analytics can help businesses improve:
- delivery times
- stock levels
- staff scheduling
- service delays
- process bottlenecks
- supplier performance
- quality control
- customer waiting times
- workload planning
For example, if customer complaints rise every Monday, the cause may not be poor staff attitude.
It may be weekend backlog, weak handover, staff shortages, or slow system updates.
Good analysis helps find the real problem.
Not just the visible symptom.
Finance analytics examples
Finance analytics can help with:
- cash flow
- cost trends
- margin analysis
- profitability
- pricing decisions
- budget variance
- debtor days
- expense control
- forecasting
- investment decisions
This connects naturally to reading financial statements.
A business may see rising revenue and assume things are improving.
But analytics may show that margins are shrinking, cash collection is slowing, and the most active customer group is not the most profitable one.
That is why data needs interpretation.
Customer behaviour analytics examples
Customer behaviour analytics looks at what people actually do.
This might include:
- what they search
- what they click
- what they buy
- what they ignore
- what they complain about
- what they return
- what they review
- what they ask before buying
- when they leave
- when they come back
This is one of the most useful areas for modern business.
Customers often reveal intent through behaviour before they say it directly.
Better decisions come from reading those signals carefully.
What this means in real business
In real business, analytics should help you decide what to change. If the analysis does not improve a decision, a process, a customer experience, a cost, or a result, it may be interesting — but it is not yet useful.
What are the biggest mistakes in data analysis and analytics?
The biggest mistakes in data analysis and analytics are starting with a vague question, trusting poor data, confusing correlation with cause, ignoring context, choosing vanity metrics, overvaluing dashboards, and treating AI-generated summaries as truth without checking the source.
This is where data work becomes risky.
Numbers can create confidence.
But confidence is not the same as correctness.
Mistake 1: Starting with data instead of a decision
This is very common.
A team says:
“Let’s analyse the data.”
But they have not agreed what decision they are trying to improve.
That often leads to unfocused analysis.
A better starting point is:
“What decision are we trying to make?”
For example:
- Should we increase marketing spend?
- Should we raise prices?
- Should we improve this service?
- Should we stop this product?
- Should we hire?
- Should we change our website?
- Should we focus on retention instead of acquisition?
Start with the decision.
Then ask what data is needed.
Mistake 2: Confusing correlation with cause
Just because two things happen together does not mean one caused the other.
For example, sales may rise after a marketing campaign.
But the real cause might be:
- seasonality
- competitor stock issues
- a price promotion
- word of mouth
- market demand
- a website change
- an external event
That does not mean the campaign did nothing.
It means you should be careful before claiming cause.
In my experience, this is one of the easiest ways for businesses to make overconfident decisions from weak evidence.
Mistake 3: Choosing metrics that look good but do not matter
These are often called vanity metrics.
Examples include:
- impressions without leads
- clicks without conversions
- traffic without trust
- followers without customers
- downloads without usage
- meetings without decisions
- activity without value
A metric is only useful if it connects to a meaningful goal.
If it makes people feel good but does not improve understanding or action, be careful.
Mistake 4: Ignoring the environment around the data
Data does not exist in a vacuum.
Numbers can be shaped by:
- seasonality
- economic conditions
- competitor behaviour
- pricing changes
- supply problems
- staff shortages
- regulation
- weather
- search engine changes
- AI search behaviour
- customer confidence
- internal process changes
If you ignore the environment, you may misread the numbers.
For example, a drop in website traffic might be caused by weaker content.
Or it might be caused by changes in Google results, AI summaries, seasonality, technical issues, or a shift in how people search.
The number is the signal.
The explanation needs context.
Mistake 5: Letting dashboards replace thinking
Dashboards are useful.
But dashboards can also make people passive.
They look at the numbers, nod, and move on.
A good dashboard should trigger better questions.
For example:
- What changed?
- Why did it change?
- Is this good or bad?
- What action should follow?
- Who owns the next step?
- What should we watch next?
- What would change our mind?
The dashboard should support judgement.
It should not replace it.
The KrisLai Data-to-Decision Lens™
- Behaviour – what are customers, staff, users, or markets actually doing?
- Signals – what patterns, changes, and anomalies are appearing in the data?
- Environment – what context might explain or distort the numbers?
- Consequences – what decision, action, or trade-off should follow?
Data becomes useful when it improves the decision that comes next.
SmartAwareness – Empower employees with knowledge and skills to stay cyber secure at work and home. 2,000+ security awareness resources and phishing simulations aligned to employee learning styles help you change behaviors and culture.
Learn more about SmartAwareness HERE.
How does AI change data analysis and analytics?
AI changes data analysis and analytics by making it easier to summarise data, generate queries, create charts, identify patterns, and explain findings. But it also increases the need for human judgement because AI can misunderstand context, repeat errors, overstate confidence, or analyse the wrong question.
AI is becoming part of everyday data work.
That is useful.
But it also creates new risks.
What AI can help with
AI can help with:
- summarising large datasets
- drafting SQL queries
- creating chart ideas
- explaining patterns
- generating hypotheses
- comparing customer segments
- writing plain-English summaries
- drafting reports
- suggesting next questions
- cleaning text responses
- grouping customer feedback
- preparing analysis outlines
For example, if you have hundreds of customer comments, AI can help group them into themes.
That can save time.
But you still need to check the output.
AI may group things badly, miss nuance, or overstate a pattern.
What AI cannot replace
AI cannot replace:
- a clear business question
- clean data
- context
- ethical judgement
- accountability
- customer understanding
- strategic thinking
- common sense
- decision responsibility
AI can help explain a trend.
But it may not understand the real-world conditions behind it.
It can generate a chart.
But it cannot guarantee the chart answers the right question.
It can summarise feedback.
But it may not know which customer comment matters most.
Why AI makes data judgement more important
AI can help you analyse faster.
But it cannot guarantee that you are analysing the right thing.
That is the key point.
In an AI-shaped world, the amount of available analysis will grow.
More summaries. More dashboards. More reports. More automatic insights. More suggested actions.
But more analysis does not automatically mean better decisions.
Someone still has to ask:
- Is the data reliable?
- What question are we answering?
- What context is missing?
- What assumption is hidden?
- What decision does this improve?
- What action should follow?
- What could happen if we are wrong?
That is where human judgement still matters.
- Want to Grow Revenue by 20XX%? Try Insightful
- Want to Increase Productivity to 95%+? Try Insightful
- Try Insightful – The #1 Workforce Analytics Solution
How can small businesses start using data better?
Small businesses can start using data better by choosing one important question, collecting only the data needed to answer it, checking the quality, looking for simple patterns, and turning the result into one practical action.
You do not need a huge analytics department to start.
You need a useful question.
Start with one decision, not a full analytics system
Start small.
Choose one decision that matters.
For example:
- Which service is most profitable?
- Which enquiry source brings real work?
- Which customers return most often?
- Which complaints keep repeating?
- Which product creates the most margin?
- Which page on the website brings enquiries?
- Which marketing activity leads to real conversations?
- Which process causes delay?
Then collect only the data needed for that decision.
This keeps the work focused.
Use simple tools first
A spreadsheet is often enough at the beginning.
You can track:
- enquiries
- source of enquiries
- conversion rates
- repeat customers
- complaints
- response times
- sales by service type
- monthly costs
- website leads
- customer feedback
The aim is not to build something impressive.
The aim is to make better decisions.
Start with what is useful.
Improve from there.
Review results regularly
A simple monthly review can help.
Ask:
- What changed?
- Why might it have changed?
- What do we know?
- What are we assuming?
- What action should we take?
- What should we measure next?
- What decision did this data improve?
This is where analytics becomes a habit.
Not a one-off project.
Final thought: data is only useful when it changes what you do
Data analysis explains.
Analytics guides.
But neither is useful if nothing changes!
A business can collect data for years and still make poor decisions if nobody asks the right questions.
The aim is not to have more dashboards.
The aim is to see more clearly.
Clean data helps.
Good tools help.
AI can help.
But the real value comes when data improves judgement.
This approach is part of the KrisLai Decision Framework, a practical method for improving business decisions.
In real business, the best question is not:
“How much data do we have?”
It is:
“What decision will this data improve?”
That question cuts through a lot of noise.
So start there.
Choose one decision.
Find the data that matters.
Check whether it is reliable.
Look for behaviour and signals.
Consider the environment.
Think about the consequences.
Then act, measure, and learn.
Do not start with the dashboard.
Start with the decision.
Final takeaway
Data analysis and analytics help businesses turn information into better decisions. The key is to start with a clear question, use reliable data, understand the context, avoid vanity metrics, and focus on insight that leads to useful action.

Related reading on KrisLai.com
- Related article: Customer Intent Marketing
- Glossary or definition article: Decision-Making Framework Examples
- Pillar topic: Business Thinking Hub
- How AI Is Changing Search Behaviour
- Problem-Solving in Business
- Financial Statements
- Business Acumen Skills
Further reading and references
Frequently Asked Questions About Data Analysis and Analytics
What is the difference between data analysis and data analytics?
Data analysis is the process of examining data to find patterns, trends, and explanations. Data analytics is the broader use of data, tools, and methods to support decisions, improve performance, and guide future action.
What is data analysis in simple terms?
Data analysis means looking closely at information to understand what happened, why it happened, and what the data may be showing. It helps turn raw information into useful insight.
What is data analytics in business?
Data analytics in business means using data to support better decisions. It can help teams understand customers, measure performance, improve operations, reduce waste, forecast trends, and choose better actions.
What are the four main types of data analysis?
The four common types of data analysis are descriptive analysis, diagnostic analysis, predictive analytics, and prescriptive analytics. They answer what happened, why it happened, what might happen next, and what should be done.
What tools are used for data analysis?
Common data analysis tools include spreadsheets, SQL, dashboards, Power BI, Tableau, Python, R, databases, and AI tools. The right tool depends on the question, the data, and the decision being made.
Why does data quality matter?
Data quality matters because poor data can lead to poor decisions. Duplicates, missing values, wrong labels, outdated records, and inconsistent definitions can make analysis misleading even when the dashboard looks professional.
How does AI affect data analytics?
AI can help summarise data, generate queries, create charts, identify patterns, and draft reports. But it cannot replace clear questions, clean data, context, ethical judgement, or human responsibility for the final decision.
About the author
Kris Lai is a business operator and managing director with experience in land and building surveying, facilities management, logistics, and service delivery.
Earlier in his career, he worked as a Search Engine Evaluator (via Lionbridge, supporting Google), where he assessed search result relevance, user intent, and content quality using structured evaluation frameworks. This experience gives him a rare, practical understanding of how search systems interpret signals and make ranking decisions.
In parallel, whilst working with a charity organisation, he has delivered 1000’s of structured presentations in English, Finnish, and Chinese to audiences ranging from small groups to more than 600 people, and has spent decades mentoring and developing others. This experience informs his approach to clarity, communication, and decision-making under pressure.
He writes about AI, search behaviour, business strategy, and decision-making from a practical, real-world perspective.
If you enjoy exploring the ideas behind better business decisions, you may find the Business Thinking Hub useful.
👉 Explore ideas connected to better business decisions:
- How AI Is Changing Search Behaviour (And What Businesses Must Do Now)

- Decision-Making Framework Examples: The KrisLai Method in Action
- The KrisLai Decision Framework: A Better Way to Make Business Decisions
- Micro vs Macro Marketing: When to Target Broad Audiences vs Niche Customers
- Customer Intent Marketing: How to Turn Buying Signals Into Sales