How financial trend analysis helps leaders spot warning signals, protect cash flow, and make better decisions under uncertainty.
Financial trend analysis helps leaders spot patterns in revenue, margins, cash flow, debtor days, stock levels, and profit quality before problems become obvious. Used well, it turns financial data into early warning signals, helping business owners and managers make better decisions under uncertainty.
This article explains what financial trend analysis is, why single numbers can mislead, which financial trends leaders should watch, how to interpret warning signals, and how to use financial trends to make better business decisions.
It also covers:
- what financial trend analysis means
- why trends matter more than isolated numbers
- financial trend analysis vs financial analysis
- trend analysis vs ratio analysis
- horizontal analysis vs vertical analysis
- financial trend analysis vs financial forecasting
- revenue growth vs profit growth
- profit vs cash flow
- leading indicators vs lagging indicators
- financial dashboards vs manual spreadsheet analysis
- how AI can support financial trend analysis
- what this looks like in real business
- what you should actually do next
- Financial trend analysis helps leaders see direction, not just position.
- Revenue growth can hide pressure if margins, cash flow, or debtor days are getting worse.
- The most useful trends often act as early warning signals before problems become urgent.
- Leaders should look at patterns across revenue, margin, cash flow, debtor days, stock levels, costs, and profit quality.
- The aim is not to admire the chart. The aim is to decide what the chart is telling you to do.
What is financial trend analysis?
Financial trend analysis is the process of comparing financial data over time to spot patterns, changes, risks, and opportunities.
In plain English, it helps you see whether the business is improving, weakening, or drifting.
A single number tells you what happened at one point.
A trend tells you what may be starting to happen.
That matters because many business problems do not arrive with flashing lights and a dramatic soundtrack. They usually arrive quietly, one small signal at a time.
Revenue grows, but margin falls.
Sales rise, but cash gets tighter.
Customers buy more, but pay later.
Stock increases, but profit quality weakens.
The headline number may say “growth”.
The trend may say “pressure”.
That is why financial trend analysis is so useful.
Financial trend analysis compares financial results over time so leaders can spot patterns, warning signals, and changes in business performance.
It is not just about looking backwards. It is about using past and current signals to make better decisions before pressure builds.
Useful background reading:
Investopedia: Financial AnalysisWhy financial trend analysis matters
Financial trend analysis matters because it helps leaders see whether the business is improving, weakening, or drifting before the problem becomes obvious.
This is important because single numbers can mislead.
A good sales month may look strong.
But what if that growth came from low-margin work?
A profit figure may look healthy.
But what if customers are paying later and cash is tightening?
A cost may look normal.
But what if it has increased every month for six months?
The number tells you where you are.
The trend tells you where you may be heading.
In my experience, this is where many business owners and managers get caught out. They look at the headline figure and miss the movement underneath.
A trend does not give you certainty.
But it does give you a signal.
And in business, early signals matter.
Financial trend analysis is most useful when it helps you ask better questions earlier.
The real value is not the chart itself. The value is the decision it helps you make.
Idea Bridge: from financial data to leadership judgement
Many finance articles explain trend analysis as a technical method.
Compare the numbers.
Calculate the change.
Look at the direction.
That is all useful.
But for leaders, the deeper question is this:
What does the trend mean for the next decision?
A leader does not need financial trend analysis just to produce a prettier report.
A leader needs it to understand pressure, risk, timing, and consequences.
This is why I see financial trend analysis as part of business thinking, not just finance.
I help people make better business decisions through psychology, strategy, and practical thinking. From that point of view, financial trends are not just numbers. They are signals about behaviour, environment, and consequences.
And if a signal is ignored for long enough, it tends to become a problem with an invoice attached.
The KrisLai Decision Framework™ and financial trends
A practical model for better business decisions in complex environments. It focuses on four essential elements:
- Human Behaviour — how people actually think and decide
- Signals — what people are trying to do right now
- Environment — whether the system supports good decisions
- Consequences — what happens next, and after that
Strong decisions consider all four — not just one.
Financial trend analysis fits this framework very well.
Human behaviour asks:
How are customers buying, paying, delaying, or changing habits?
Signals ask:
What are revenue, margin, cash flow, debtor days, stock levels, and cost trends telling us?
Environment asks:
Are market conditions, supplier prices, customer demand, competition, or AI search behaviour changing?
Consequences ask:
What happens if we ignore the trend?
This approach is part of the KrisLai Decision Framework, a practical method for improving business decisions.
Better decisions always come from understanding behaviour, signals, environment, and consequences.
Financial trend analysis vs financial analysis
Financial analysis examines financial health and performance, while financial trend analysis focuses on how financial results change over time.
Both are useful.
They simply answer different questions.
Comparison: Financial Analysis vs Financial Trend Analysis
| Financial Analysis | Financial Trend Analysis |
|---|---|
| Looks at financial health and performance | Looks at movement and direction over time |
| Often answers “Where are we now?” | Often answers “Where are we heading?” |
| Uses statements, ratios, and performance measures | Uses patterns, changes, and comparisons across periods |
For example, financial analysis may show that your gross margin is 35%.
Financial trend analysis may show that your gross margin has fallen from 42% to 35% over six months.
That second point is much more useful for leadership.
It shows movement.
Movement invites questions.
Questions lead to better decisions.
Trend analysis vs ratio analysis: what is the difference?
Trend analysis compares figures over time, while ratio analysis compares relationships between figures, such as profit margin, liquidity, or debt levels.
Here is a simple example:
Trend analysis says:
Gross margin has fallen for four months.
Ratio analysis says:
Gross margin is now 31%.
Better insight says:
Gross margin is falling and is now close to a danger level.
That is why the two methods work well together.
A ratio gives you a measure.
A trend gives you direction.
Together, they help you judge whether the business is stable, improving, or weakening.
Trend analysis shows how a financial figure changes over time. Ratio analysis shows the relationship between two financial figures.
Leaders should use both. A ratio tells you the position. A trend tells you whether that position is improving or getting worse.
Horizontal analysis vs vertical analysis
Horizontal analysis compares financial figures across time, while vertical analysis compares figures within the same financial statement as a percentage of a base figure.
That may sound technical, so let’s make it simple.
Horizontal analysis asks:
What changed compared with last month, last quarter, or last year?
Vertical analysis asks:
What share of the total does this figure represent?
For example:
Horizontal analysis may show that operating expenses have increased by 18% over the year.
Vertical analysis may show that operating expenses now take up 42% of revenue.
Both are useful.
One shows movement.
The other shows proportion.
| Horizontal Analysis | Vertical Analysis |
|---|---|
| Compares results across time | Compares items within one statement |
| Shows increases, decreases, and trends | Shows proportions and structure |
| Useful for spotting movement | Useful for seeing where money goes |
Financial trend analysis vs financial forecasting
Financial trend analysis looks at what has changed over time, while financial forecasting estimates what may happen next.
Again, both are useful.
Trend analysis helps you understand direction.
Forecasting helps you plan ahead.
For example:
A cash flow trend may show that cash is tightening every quarter.
A cash flow forecast may show when the business may run short of cash.
The trend gives the warning.
The forecast helps you plan the response.
Trends are useful, but they are not promises. Past performance can help you understand direction, but it does not guarantee what will happen next.
Conditions change. Customers change. Costs change. Competitors change. That is why trend analysis should support judgement, not replace it.
The Financial Signal Ladder
The Financial Signal Ladder is a simple way to read financial trends in the right order.
Revenue → Margin → Cash flow → Debtor days → Stock levels → Profit quality → Decision
The easiest way to understand financial trend analysis is to read the signals in order, starting with headline performance and moving towards deeper business meaning.
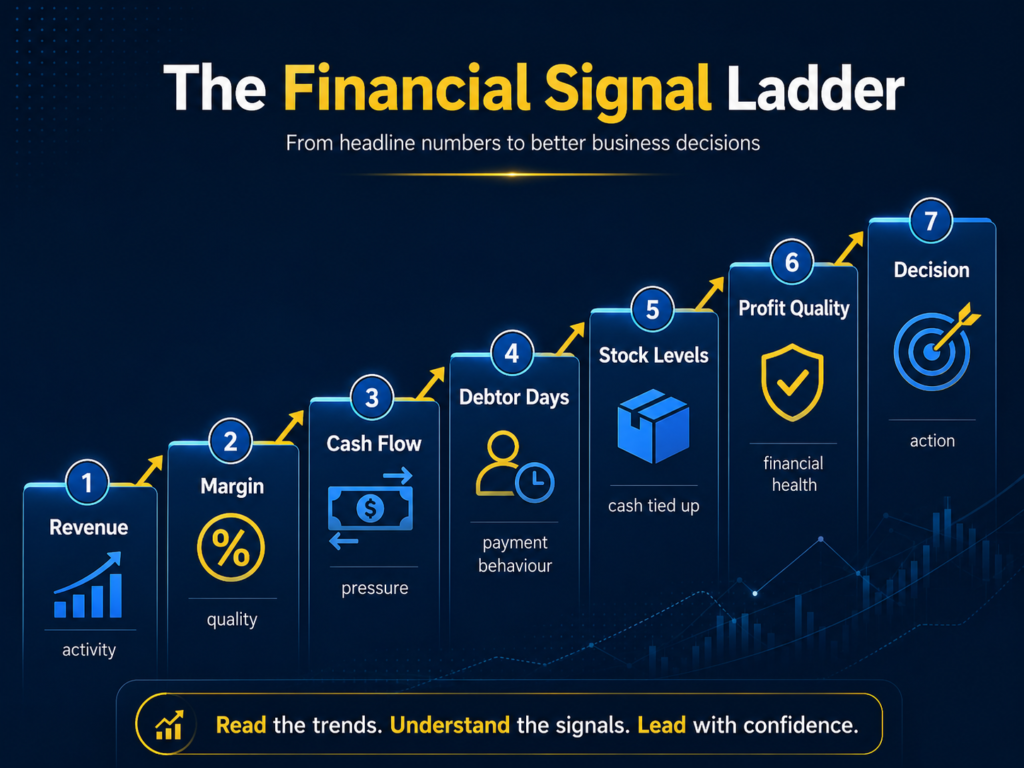
Used properly, this ladder helps leaders move beyond “sales are up” and ask the more useful question: “What do these financial signals really mean for the next decision?”
Each step tells you something different.
Revenue tells you activity.
Margin tells you quality.
Cash flow tells you pressure.
Debtor days tell you payment behaviour.
Stock levels tell you operational discipline.
Profit quality tells you whether profit is real, sustainable, and supported by cash.
Decision turns the signal into action.
Revenue → Margin → Cash flow → Debtor days → Stock levels → Profit quality → Decision
This framework helps leaders move from headline numbers to better business decisions. It asks not only “what changed?” but “what does this signal mean?”
7 financial trends leaders should watch
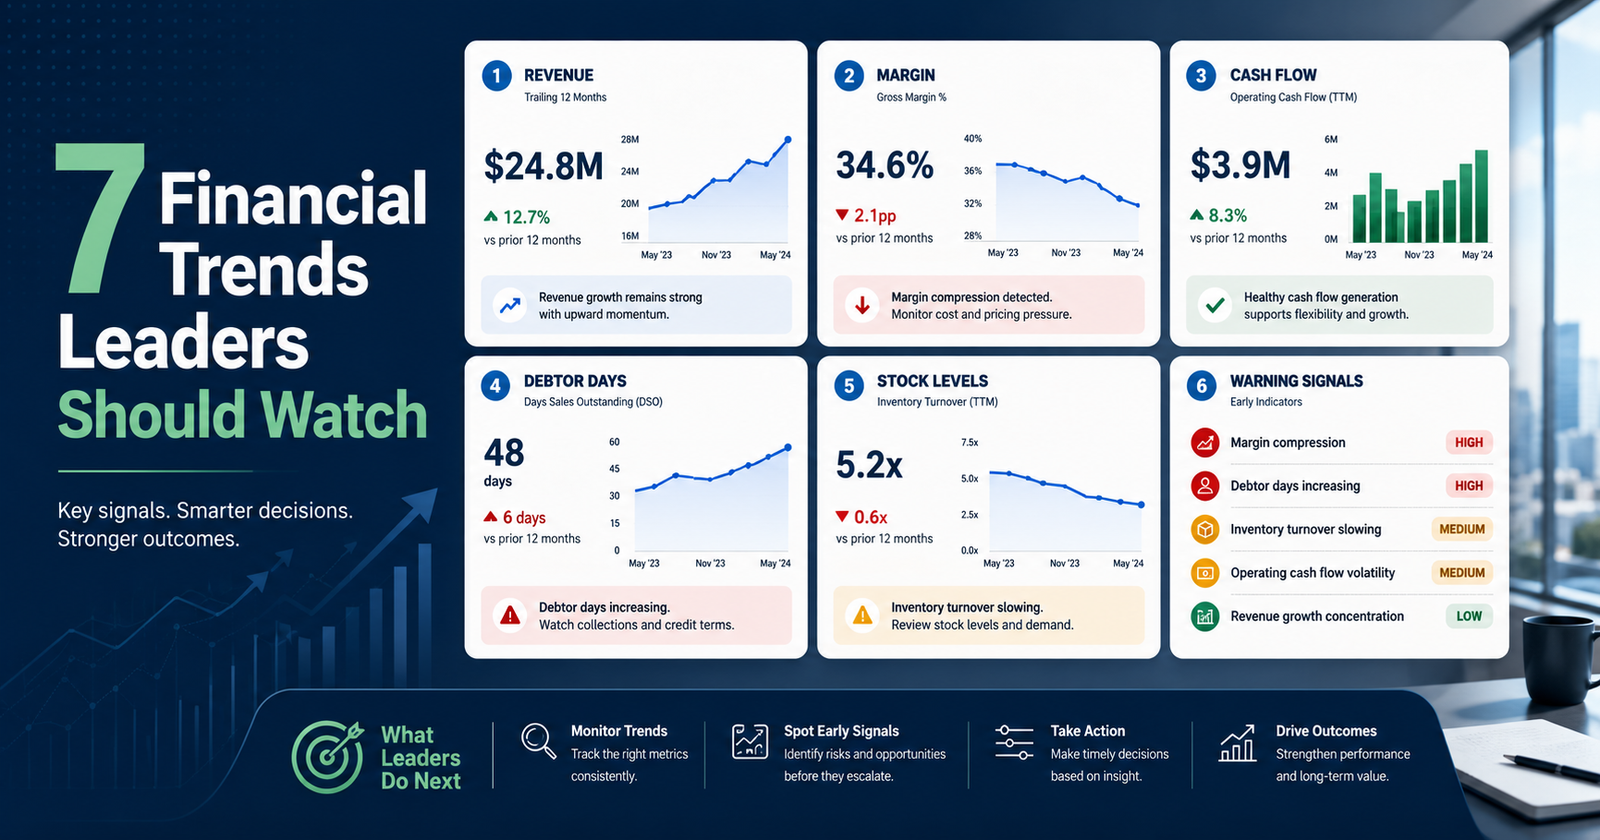
Leaders should watch revenue, gross margin, cash flow, debtor days, stock levels, operating expenses, and profit quality because these trends reveal whether the business is healthy, pressured, or drifting.
Let’s break them down.
1. Revenue trend
Revenue trend shows whether sales are rising, falling, flat, seasonal, or unstable.
Revenue matters because it shows activity.
But revenue alone is not enough.
Ask:
Is revenue rising?
Is revenue predictable?
Is growth coming from the right customers?
Is revenue seasonal?
Are sales rising but profit not following?
Is one customer driving too much of the increase?
Are new leads still coming in?
Are customers finding us through Google, social media, referrals, or AI tools?
Revenue growth can look exciting. It can also hide pressure.
In my experience, leaders should be careful when sales rise but everything else feels harder.
That may mean the business is growing in the wrong way.
Useful related reading:
Customer Intent Marketing: How to Turn Buying Signals Into Sales2. Gross margin trend
Gross margin trend shows whether the business is keeping enough money from each sale after direct costs.
This is one of the most important financial trends to watch.
If revenue rises but gross margin falls, the business may be working harder for weaker results.
That can happen when:
supplier costs rise
prices are too low
discounts increase
delivery costs grow
low-margin customers increase
waste or rework rises
staff time is underestimated
the wrong products or services grow fastest
This is where many businesses get caught.
The sales graph looks happy.
The margin graph quietly looks unwell.
And the owner is left wondering why more work does not feel like more progress.
Revenue growth is not the same as profit growth. If sales are rising but margin is falling, the business may be growing pressure rather than value.
3. Cash flow trend
The cash flow trend shows whether money coming into the business is enough, steady enough, and timely enough to cover money going out.
Profit is important.
Cash keeps the lights on.
That may be a simple sentence, but it is worth remembering.
A business can report profit and still struggle to pay bills if cash is tied up in unpaid invoices, stock, tax, equipment, or slow payment cycles.
Ask:
Is cash improving or tightening?
Are outgoings arriving before income?
Are customers paying late?
Are we relying more on overdrafts or credit?
Are we regularly short before payday, VAT, or supplier payments?
Is cash pressure repeating each month?
Cash flow trend analysis helps leaders avoid being surprised by pressure that was already building.
Useful related reading:
Cash Flow Forecasting as an Early-Warning Decision Tool| Profit | Cash Flow |
|---|---|
| Shows whether income is higher than costs | Shows whether money is available when needed |
| Can look healthy on paper | Can still be tight in the bank |
| Useful for performance | Vital for survival |
4. Debtor days and accounts receivable trend
Debtor days show how long customers take to pay.
This trend matters because sales are not fully useful until cash is collected.
A business may be selling more, but if customers are taking longer to pay, growth can create cash pressure.
Ask:
Are customers taking longer to pay?
Are overdue invoices increasing?
Are payment terms too generous?
Are large customers using your business as free credit?
Is growth being funded by unpaid invoices?
Are payment reminders going out early enough?
What I’ve seen many times is this: a business celebrates new work, then quietly struggles because the cash has not arrived.
That is not a sales problem.
It is a payment behaviour problem.
This is why debtor days belong on the Financial Signal Ladder.
They tell you how customers are behaving after the sale.
And customer behaviour affects cash.
5. Stock levels and inventory trend
Stock levels show whether money is being tied up in products, materials, parts, or supplies.
This matters because stock can quietly trap cash.
Ask:
Is stock rising faster than sales?
Are slow-moving items increasing?
Are we buying too early?
Are shortages causing missed sales?
Are storage costs increasing?
Are old items being written off?
Is stock being managed by evidence or habit?
Stock is not always bad.
You need enough stock or materials to serve customers.
But too much stock can turn money into shelves.
Very neat shelves, perhaps.
But shelves do not pay bills.
6. Operating expense trend
The operating expense trend shows whether overheads are rising faster than revenue.
This includes costs such as:
rent
wages
software
insurance
repairs
marketing
professional fees
fuel
utilities
subscriptions
training
office costs
Operating costs often rise quietly.
One new tool here.
One extra subscription there.
A small increase in insurance.
A bit more marketing spend.
A few repairs.
Then suddenly the cost base is heavier than expected!
Ask:
Are overheads rising faster than revenue?
Are fixed costs becoming too heavy?
Are subscriptions still useful?
Are marketing costs producing quality leads?
Are staff costs matched by productivity?
Are costs rising because the business is growing, or because control has weakened?
Cost creep is boring until it becomes painful. Small increases can look harmless in isolation, but the trend may show that the business is slowly becoming harder to run profitably.
7. Profit quality trend
Profit quality shows whether profit is real, repeatable, and supported by cash.
Not all profit is equally healthy.
Some profit comes from strong repeatable trading.
Some profit comes from one-off gains.
Some profit looks good because costs were delayed.
Some profit appears while cash flow weakens.
Some profit depends too heavily on one customer, one product, or one lucky month.
Ask:
Is profit backed by cash?
Is profit repeatable?
Is profit coming from the right customers?
Are margins improving or weakening?
Are costs being delayed?
Is profit dependent on one-off gains?
Is growth improving the business or stretching it?
This is where leaders need judgement.
A profit figure can look good, but the trend may show that quality is weakening.
Here are some of the clearest financial warning signals that tell you pressure may be building beneath the surface, even when the headline numbers still look respectable:
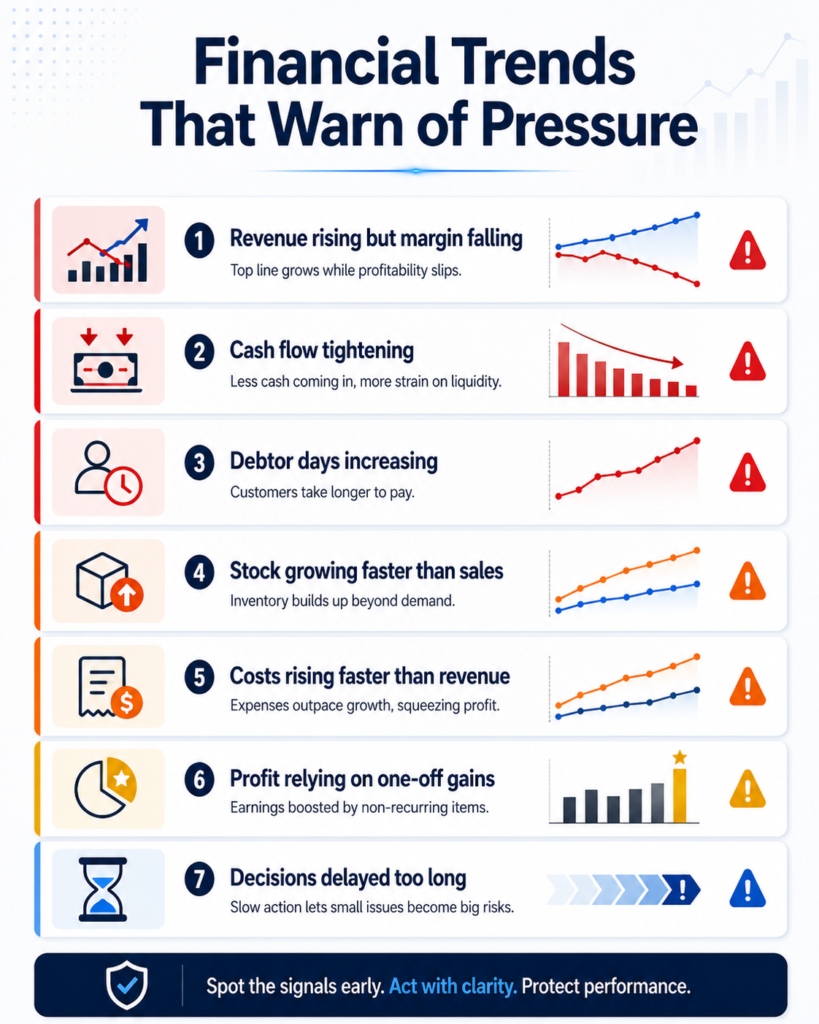
In my experience, businesses rarely run into trouble without giving some sort of warning first. The challenge is not whether signals exist, but whether leaders notice them early enough to act.
What this looks like in real business
A business sees sales rising, so the owner assumes things are improving.
At first glance, that seems fair.
More sales should mean better business, right?
Not always.
The owner looks deeper and finds three trends:
Gross margin is falling.
Debtor days are rising.
Cash flow is tightening.
The headline number says “growth”.
The trend says “pressure”.
This is the kind of financial trend analysis that actually helps leaders.
The decision should not simply be:
“Great, sales are up. Let’s celebrate.”
The better decision questions are:
Why is margin falling?
Are we discounting too much?
Are supplier costs rising?
Are we attracting the wrong type of customer?
Why are customers taking longer to pay?
Do we need tighter payment terms?
Is growth using more cash than expected?
Should we pause some spending?
Should we review pricing?
Should we reduce low-margin work?
This is the pattern I like to use:
Insight → real example → decision → consequence.
The insight is that growth can hide pressure.
The example is rising revenue with falling margin and tighter cash.
The decision is to review pricing, customer mix, payment terms, and costs.
The consequence of ignoring it is simple: the business may grow itself into a cash problem.
And yes, that is as annoying as it sounds.
The strongest business is not always the one with the highest revenue. It is often the one where revenue, margin, cash flow, and payment behaviour are moving in the right direction together.
Where this goes wrong
Financial trend analysis goes wrong when leaders look at one number in isolation, confuse growth with health, ignore cash flow, wait too long, or treat trends as certainty.
Let’s look at the common mistakes.
Looking at one number in isolation
Revenue alone is not enough.
Profit alone is not enough.
Cash alone is not enough.
Each number needs context.
A single figure can be useful, but it rarely tells the whole story.
Confusing growth with health
Growth can be good.
But growth can also create pressure.
More sales may mean more stock, more staff, more delivery costs, more admin, more unpaid invoices, and more working capital.
If growth weakens cash flow and margin, leaders need to pause and ask better questions.
Ignoring cash flow
This is one of the biggest mistakes.
A business can look successful and still feel financially stretched.
Cash flow trend analysis helps leaders see whether the business is becoming more or less comfortable.
Waiting too long
By the time a financial problem is obvious, your choices may be fewer.
Early signals give you more room to act.
Late signals often leave you choosing between bad options.
And nobody enjoys a menu of bad options.
Using old data without context
Financial data matters, but context matters too.
A trend may be affected by seasonality, a one-off event, a major customer, supplier problems, changes in search behaviour, or wider market conditions.
Do not read the chart as if the outside world does not exist.
It does.
And it has opinions.
Treating trends as certainty
Trends suggest direction.
They do not guarantee the future.
This is important.
Financial trend analysis should support judgement. It should not become blind faith in the past.
The biggest mistake is treating a trend as an answer rather than a signal.
A trend should trigger better questions, not automatic decisions.
Leading indicators vs lagging indicators
Leading indicators suggest what may happen next, while lagging indicators show what has already happened.
Both matter.
But they do different jobs.
| Leading Indicators | Lagging Indicators |
|---|---|
| Point to what may happen next | Show what has already happened |
| Examples: enquiries, conversion rate, debtor days, pipeline quality | Examples: last month’s revenue, profit, completed sales |
| Useful for early action | Useful for review and learning |
A leader should not only ask, “What happened?”
A leader should also ask, “What is starting to happen?”
That second question is where early warning signals live.
Financial dashboards vs manual spreadsheet analysis
Financial dashboards help leaders see trends quickly, while manual spreadsheet analysis can be useful for deeper review, testing, and explanation.
Neither is automatically better.
The right choice depends on the business.
Dashboards are useful because they show movement quickly.
Spreadsheets are useful because they allow deeper thinking.
The danger with dashboards is that they can make poor data look professional.
The danger with spreadsheets is that they can become slow, messy, and dependent on one person.
| Financial Dashboards | Manual Spreadsheet Analysis |
|---|---|
| Good for regular monitoring | Good for deeper investigation |
| Can show trends quickly | Can test assumptions and scenarios |
| Depends on clean data | Can become manual and error-prone |
Useful related reading:
Financial Dashboards That Help Leaders Make Better DecisionsHistorical trends vs future uncertainty
Historical trends show what has happened, while future uncertainty reminds leaders that conditions can change.
This is a very important point.
Financial trend analysis is useful.
But it is not magic.
It does not remove uncertainty.
It helps leaders respond to uncertainty earlier.
A trend can tell you:
margin is weakening
cash is tightening
customers are paying later
stock is rising
costs are creeping up
But it cannot guarantee what will happen next.
That is why leaders should combine trend analysis with:
scenario planning
cash flow forecasting
budget reviews
customer signals
market context
AI search behaviour
supplier information
decision triggers
This is real-world strategy.
Not textbook strategy.
Useful related reading:
Scenario Planning: How to Navigate UncertaintyHow to do financial trend analysis step by step
To do financial trend analysis, choose a business question, select the right financial signals, collect data over time, compare like with like, calculate changes, look for patterns, ask why they changed, and decide what action should follow.
Here is a practical process:
Step 1: Choose the question
Start with a clear question.
For example:
Are we becoming more profitable?
Is growth creating cash pressure?
Are costs rising faster than sales?
Are customers taking longer to pay?
Is stock tying up too much money?
Is the business becoming stronger or more fragile?
A clear question prevents the analysis from becoming “let’s stare at numbers until wisdom appears”.
Step 2: Choose the right financial signals
Choose the signals that match the question.
For example:
If the question is about growth, look at revenue, margin, cash flow, and debtor days.
If the question is about profit, look at gross margin, operating expenses, and profit quality.
If the question is about cash pressure, look at cash flow, debtor days, stock levels, and payment timing.
Step 3: Collect data over time
Use monthly, quarterly, or yearly data.
Monthly data is often best for small business management because it shows movement quickly enough to act.
Try to compare:
this month with last month
this month with the same month last year
this quarter with last quarter
year-to-date against budget
Step 4: Compare like with like
Do not compare a busy seasonal month with a quiet month and draw wild conclusions.
Seasonality matters.
One-off events matter.
Large orders matter.
A change in supplier costs matters.
Context matters.
Step 5: Calculate the change
Look at both:
the absolute change
the percentage change
For example:
Revenue increased by £20,000.
Revenue increased by 12%.
Both figures are useful.
A percentage change helps you compare trends across different sizes of numbers.
Step 6: Look for patterns
Look for trends such as:
rising
falling
flat
seasonal
unstable
sudden change
slow decline
repeated pressure
You are looking for movement that matters.
Step 7: Ask what changed and why
This is where the thinking begins.
Ask:
What caused the change?
Was it one-off or repeated?
Was it internal or external?
Was it customer behaviour?
Was it cost pressure?
Was it pricing?
Was it timing?
Was it marketing?
Was it capacity?
Was it the market?
Step 8: Decide what action follows
A trend is useful only if it improves the decision.
For example:
If margin is falling, review pricing and costs.
If debtor days are rising, tighten credit control.
If cash is tightening, review payment timing.
If stock is rising, review purchasing and demand.
If marketing spend is rising without better leads, review message, channel, and customer intent.
If revenue is growing but profit quality is weakening, review customer mix.
Do not end financial trend analysis with “interesting”. End it with a decision.
The useful question is: what should we do differently because of what this trend is telling us?
Financial trend analysis and decision-making under uncertainty
Financial trend analysis does not remove uncertainty, but it helps leaders respond to it earlier and with better judgement.
This matters because many business decisions are made with incomplete information.
You rarely know everything.
You do not know exactly what customers will do.
You do not know exactly what costs will do.
You do not know exactly how competitors, AI search, suppliers, or the wider economy will behave.
But you can still make better decisions by watching the right signals.
For example:
If debtor days rise for three months, do not wait until cash is in trouble.
If margin falls for two quarters, do not wait until profit disappears.
If stock grows faster than sales, do not wait until cash is trapped.
If marketing spend rises but lead quality drops, do not wait until the budget is gone.
This is where financial trend analysis becomes a leadership habit.
Over time, I’ve found that good decisions rarely come from data alone. They come from understanding people, reading signals, creating the right environment, and thinking beyond the immediate outcome.
Decision quality depends on asking the right question, using meaningful information, comparing options, understanding trade-offs, and committing to action.
Useful decision-making reference sources:
Strategic Decisions Group: Decision QualityCan AI help with financial trend analysis?
AI can help financial trend analysis by spotting patterns, summarising data, flagging unusual changes, and helping leaders ask better questions, but it should not replace human judgement.
AI tools can help with:
summarising financial reports
spotting unusual changes
comparing periods
drafting review questions
highlighting possible risks
supporting forecasting
building dashboards
finding patterns across large data sets
But AI still needs clean data.
It also needs context.
An AI tool may spot that margin is falling.
But it may not fully understand that a new supplier, a staff shortage, a pricing mistake, or a change in customer behaviour caused the issue.
This is why AI should support leadership judgement, not replace it.
AI can help you see signals.
Leaders still need to decide what those signals mean.
This is especially important as customers change how they search, compare, and choose suppliers.
AI and changing search behaviour may affect:
lead volume
lead quality
website traffic
content performance
sales conversion
customer expectations
buying journeys
If your revenue trend changes, do not only look at the finance report.
Look at customer behaviour too.
Useful related reading:
How AI Is Changing Search BehaviourWhat is financial trend analysis?
Financial trend analysis compares financial data over time to spot patterns, risks, and opportunities.
Why is financial trend analysis important?
It helps leaders see whether performance is improving, weakening, or drifting before problems become obvious.
What is an example of financial trend analysis?
A business may see revenue rising while margin falls and cash tightens. The trend shows pressure even though sales are growing.
What financial trends should leaders watch?
Leaders should watch revenue, margin, cash flow, debtor days, stock levels, operating expenses, and profit quality.
Can AI help with financial trend analysis?
Yes, AI can help spot patterns and summarise data, but leaders still need to check context and make the final decision.
What you should actually do
Here is the simple version:
Choose five to seven financial trends to review every month.
Track them in a simple dashboard or spreadsheet.
Compare each trend with last month, last quarter, and the same period last year.
Look for movement, not just the latest number.
Ask what changed.
Ask why it changed.
Ask whether it is a one-off or a trend.
Connect each signal to a possible decision.
Review the trends before problems become urgent.
Start with these seven:
Revenue
Gross margin
Cash flow
Debtor days
Stock levels
Operating expenses
Profit quality
Then ask:
What is improving?
What is weakening?
What is drifting?
What needs action?
What happens if we ignore this for another three months?
That last question is powerful.
It brings consequences into the decision.
This connects closely to how I think about decisions more broadly in the KrisLai Decision Framework™.
A financial trend is not just a line on a chart.
It is a signal.
And a signal should help you decide.
Financial trend analysis works best when it is connected to budgeting, cash flow forecasting, break-even analysis, dashboards, and customer demand signals.
Do not treat financial trends as isolated numbers. Treat them as part of a wider decision system.
Useful related reading:
7 Steps to Build a Smarter Small Business BudgetFAQ
What is financial trend analysis?
Financial trend analysis is the process of comparing financial data over time to spot patterns, changes, risks, and opportunities.
Why is financial trend analysis important?
Financial trend analysis is important because it helps leaders see whether the business is improving, weakening, or drifting before problems become obvious.
What is an example of financial trend analysis?
An example of financial trend analysis is comparing revenue, margin, cash flow, and debtor days over several months. A business may see sales rising, but if margin falls and customers take longer to pay, the trend may show growing pressure.
How do you prepare a financial trend analysis?
To prepare a financial trend analysis, choose the business question, select the right financial signals, collect data over time, compare like with like, calculate changes, look for patterns, ask what changed, and decide what action should follow.
What is the difference between financial analysis and financial trend analysis?
Financial analysis looks at financial health and performance. Financial trend analysis looks at how financial results change over time.
What is the difference between trend analysis and ratio analysis?
Trend analysis compares figures over time. Ratio analysis compares relationships between figures, such as profit margin, liquidity, or debt levels.
What financial trends should leaders watch?
Leaders should watch revenue, gross margin, cash flow, debtor days, stock levels, operating expenses, and profit quality.
How does financial trend analysis help decision-making?
Financial trend analysis helps decision-making by showing early warning signals, helping leaders ask better questions, and supporting action before problems become urgent.
What are the limitations of financial trend analysis?
Financial trend analysis is limited because past trends do not guarantee future results. Trends also need context, such as market changes, customer behaviour, seasonality, supplier costs, and one-off events.
Can AI help with financial trend analysis?
Yes. AI can help spot patterns, summarise data, flag unusual changes, and support forecasting. But leaders still need to check the data, understand the context, and make the final decision.
Research and experience note
This article is based on practical business experience, independent research, and analysis of how financial trends are used in real decision-making.
Useful reference sources include:
Investopedia: Financial Analysis