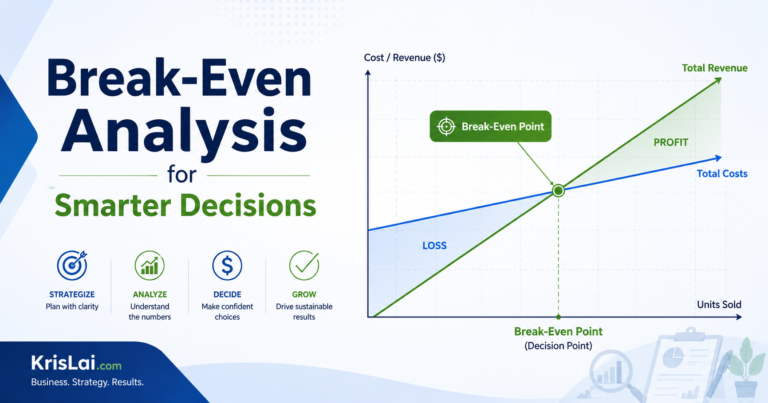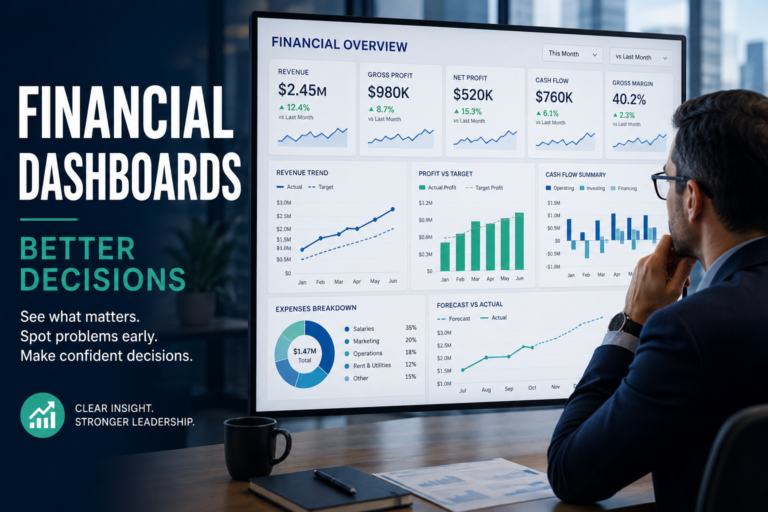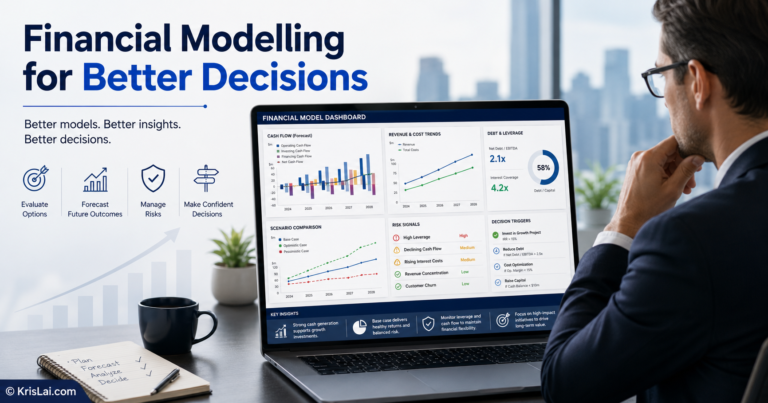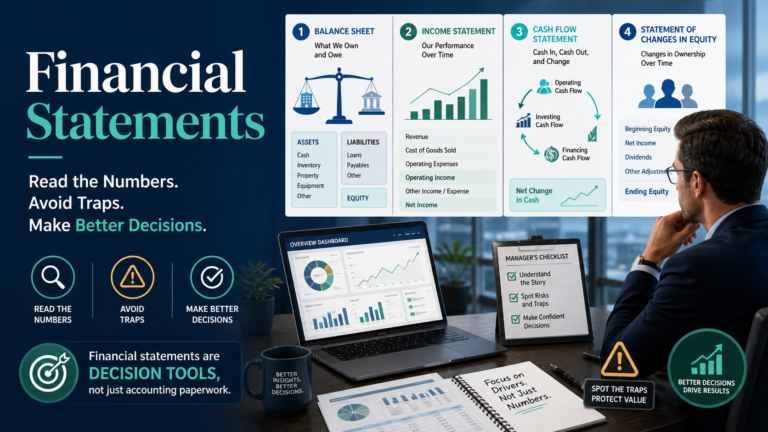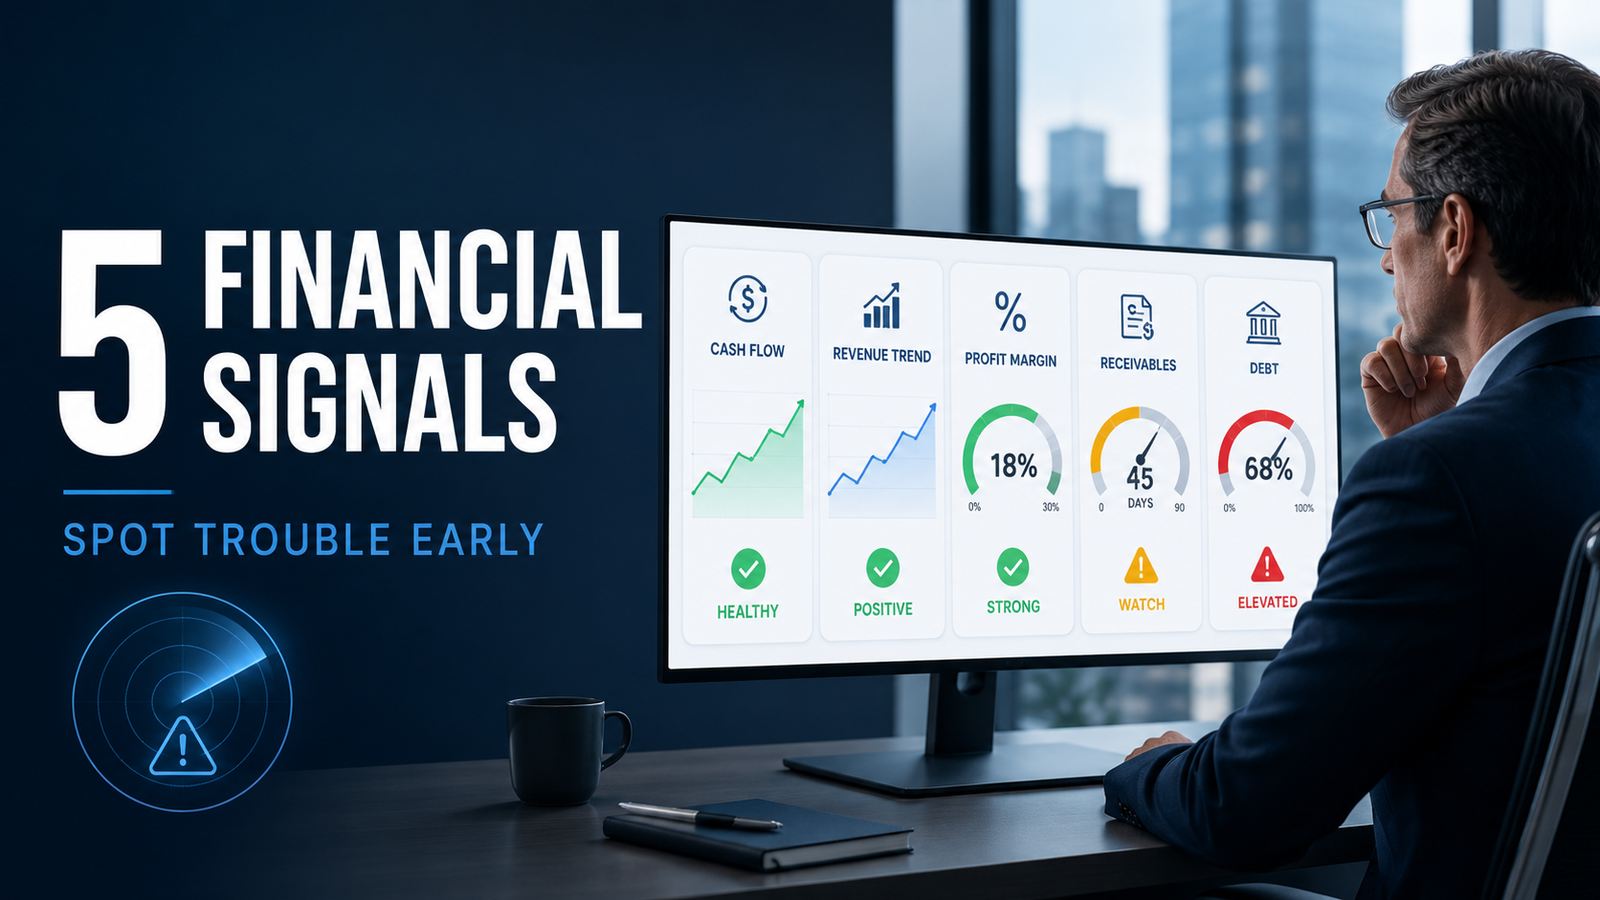
Financial trouble rarely begins with one dramatic event. More often, it starts with small changes in cash, margins, revenue, receivables, and debt. These financial signals help leaders spot risk early, understand what the numbers are really saying, and act before pressure becomes more expensive.
Business trouble usually shows up in the numbers before it shows up in the panic.
That is the first thing I want to say.
Most problems do not begin with a dramatic collapse, a boardroom showdown, or somebody dropping a spreadsheet in horror. They begin quietly. A margin slips. A receivables balance grows. Cash gets tighter even though sales still look respectable. Debt creeps up faster than the business itself.
That is why I think financial ratios matter.
In plain English, financial ratios are simple ways of comparing figures from the financial statements so you can understand liquidity, margins, efficiency, debt, and financial health more clearly. Ratio analysis is basically the process of using those comparisons to spot patterns, trends, strengths, and warning signs. That is the core definition used across Investopedia, CFI, ACCA, and other finance-reference sources. (investopedia.com)
But I do not want to stop at the definition!
I write about how better decisions are made in business — combining strategy, behaviour, and practical thinking. So for me, financial ratio analysis matters because it helps leaders see what is changing before the consequences become harder to manage.
This approach is part of the KrisLai Decision Framework, a practical method for improving business decisions. Better decisions always come from understanding behaviour, signals, environment, and consequences. Financial ratios are part of that signal-reading process. Over time, I’ve found that good decisions rarely come from data alone. They come from understanding people, reading signals, creating the right environment, and thinking beyond the immediate outcome.
Financial ratios are comparisons between key numbers in the financial statements. They help show liquidity, profitability, efficiency, and debt pressure more clearly than raw figures on their own.
- Financial ratios are most useful as patterns, not isolated numbers.
- One weak signal may not be a crisis, but several together usually mean it is time to act.
- Leaders do not need to be accountants to use key financial ratios well.
- Good ratio analysis helps you spot risk before pressure becomes a bigger problem.
- Busy does not always mean healthy. Activity and financial strength are not the same thing.
If you remember nothing else but this, remember this: financial ratios matter because they help you spot trouble early. They show whether cash is tightening, margins are weakening, customers are paying late, or debt is growing faster than the business can comfortably carry.
What are financial ratios?
Financial ratios are comparisons between figures in the financial statements that help show how a business is really performing.
That is the direct answer.
Most financial ratios are built from numbers in the income statement, balance sheet, and sometimes the cash flow statement. Investopedia describes ratio analysis as a way of evaluating a company’s financial condition by comparing key figures from its financial statements, while CFI and EBSCO take a similar approach. (investopedia.com)
The reason this matters is simple: raw numbers can look impressive without telling the full story.
A business can show:
- strong sales
- a decent-looking profit
- plenty of activity
- and still be drifting into pressure
That is why financial ratios explained properly are useful. They help turn financial data into signals a leader can actually use.
What is ratio analysis in plain English?
Ratio analysis is the process of using those comparisons to understand how the business is really doing.
That means looking at:
- liquidity ratios
- profitability ratios
- efficiency ratios
- activity ratios
- leverage ratios
- solvency ratios
Those categories show up repeatedly in the strongest search results because they are the basic map people want when they search what are financial ratios, financial ratios meaning, or financial ratio analysis. (corporatefinanceinstitute.com)
Why does one ratio on its own rarely tell the full story?
One ratio on its own rarely tells the full story because business pressure usually appears in patterns, not in neat isolation.
That is one of the most important points in ratio analysis. Investopedia is very clear that ratios are most useful when compared over time or against peers, not when lifted out of context and treated like a fortune cookie. (investopedia.com)
A current ratio may look fine on its own. But if:
- gross profit margin is shrinking
- accounts receivable days are rising
- and debt to equity ratio is climbing
then the picture changes.
That is what I mean by signals.
Why should leaders care before the finance team raises the alarm?
Leaders should care early because by the time the alarm becomes obvious, the number of good options is often smaller.
In my experience, the strongest leaders do not wait for a crisis-level memo. They watch the key financial ratios that often move first. They ask what changed. They look for the cause. They act while the fix is still reasonably cheap.
This connects closely to how I think about decisions more broadly in the KrisLai Decision Framework™. Good decisions come from reading small signals early, not performing last-minute heroics after months of drift.
Which financial signals often show trouble first?
The financial signals that often show trouble first are usually cash, revenue trend, margins, receivables, and debt.
That is why this article is not trying to become a complete encyclopedia of every possible ratio. The SERP already has plenty of long lists and financial ratios formula pages. Investopedia, CFI, AccountingCoach, and CFA material already do that thoroughly. (corporatefinanceinstitute.com)
My aim here is different.
I want to focus on the important financial ratios and financial warning signals that leaders can use before problems escalate.
Before we look at each one in more detail, here is a simple visual summary of the five financial signals that often move first when pressure starts to build:
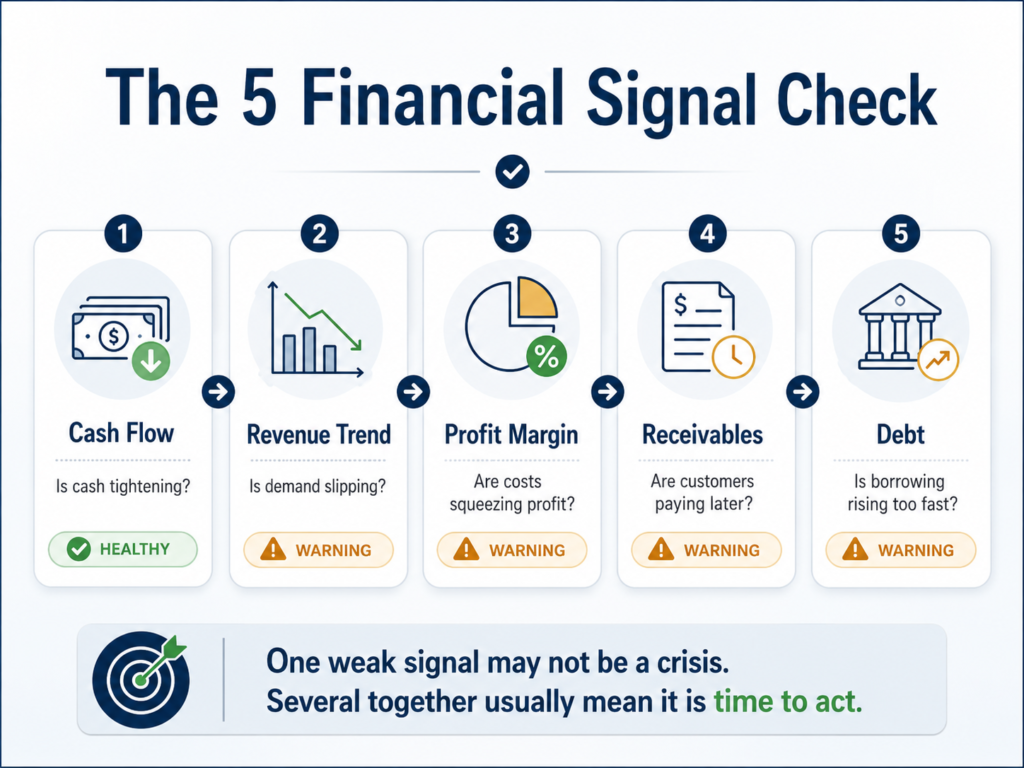
One weak signal may not be a crisis. Several together usually mean it is time to pay closer attention and act early.
Is cash flow tightening even though sales still look fine?
Yes — and this is often the first place trouble shows up in real businesses.
A business can still look active, busy, and even “successful” while cash gets tighter underneath. That is why business financial health ratios and cash indicators matter so much. Strong revenue is nice. Money in the bank at the right moment is nicer!
This is one reason I would never separate ratio analysis from cash flow forecasting or working capital decisions. If cash is tightening, supplier payments start feeling heavier, payroll becomes less comfortable, and ordinary decisions suddenly carry more stress.
What I have seen is that leaders often assume revenue means safety. It does not! Revenue is not a hug from your bank account.
Is revenue slipping for more than one cycle?
Yes — and if revenue is slipping for more than one cycle, it is worth paying attention even if one good month briefly cheers everyone up.
A drop in sales over time can point to:
- weaker demand
- pricing pressure
- customer churn
- a poor sales mix
- competitive drift
- changes in the sales process
This is where ratio analysis examples become more useful when paired with trend thinking. A one-off dip may be noise. Two or three cycles of decline are usually trying to tell you something.
In real-world strategy, the question is not only “did revenue fall?” It is “what changed, and what does that suggest?” That connects naturally to my articles on dynamic strategy and scenario planning.
Are profit margins being squeezed?
Yes — and when profit margins are being squeezed, the business usually becomes less resilient long before it becomes visibly distressed.
This is where gross profit margin and net profit margin matter.
They help show whether:
- rising costs are biting
- discounting is getting out of hand
- pricing is weaker than it looks
- the business is losing room to absorb shocks
Investopedia’s well-known shortlist of basic ratios puts margin firmly in the “must watch” group, and that makes sense. Margins tell you whether the business is keeping enough value from what it sells. (investopedia.com)
In my experience, margin pressure is one of the quieter warning signs because the business can still look active. Phones ring. Orders come in. People look busy. But if margin keeps weakening, activity starts becoming an expensive hobby.
Are customers paying later and later?
Yes — and when customers are paying later and later, strong sales can still hide a growing cash problem.
That is why receivables turnover ratio and accounts receivable days matter. ACCA is especially useful here because it highlights receivables collection period as a practical ratio that shows how long customers are taking to pay. (accaglobal.com)
When this starts slipping, it can mean:
- weaker collections
- poor credit control
- customer strain
- too much tolerance of slow-paying accounts
- or sales being booked faster than cash is being collected
This is one of those areas where financial ratios for small business are especially useful. Small firms often feel this pressure sooner because they have less room to absorb delay.
Is debt growing faster than the business?
Yes — and when debt is growing faster than the business, the business may be using borrowing to cover recurring weakness rather than funding healthy growth.
That is where debt to equity ratio, other leverage ratios, and broader solvency ratios become important.
Debt is not automatically bad. Sometimes it is sensible. Sometimes it supports growth. But if borrowing keeps rising while revenue, margins, or collections weaken, then the business is losing flexibility. Repayments start shaping decisions. Refinancing risk grows. Options narrow.
That is the practical point behind many financial ratios for business leaders. They are not there to look clever in a board pack. They are there to show whether the business is becoming harder to steer.
The Financial Signal Loop
Cash pressure → revenue trend → margin change → receivables delay → debt strain → leadership decision → stronger resilience or bigger problems
What this looks like in real business
In real business, financial stress usually appears as a messy combination of signals rather than one neat ratio waving a little flag.
That is the direct answer.
Why do warning signs often appear together, not one at a time?
Warning signs often appear together because business pressure usually spreads through connected parts of the system.
For example:
- revenue may soften
- margins may shrink
- customers may pay later
- debt may rise to cover the gap
Each signal on its own may not look dramatic. Together, they tell a stronger story.
That is why financial ratios examples are more useful when treated as a pattern, not a checklist. One weak signal is worth watching. Several weak signals together usually mean it is time to act.
What does the small-business version of this problem look like?
The small-business version usually looks busier than it feels.
The phone rings. Work comes in. People are trying hard. The owner is topping up the gaps personally, delaying a few bills, and telling themselves it is only temporary.
What I have seen is that this creates false comfort. The business looks active, so it must be fine. But activity is not the same as health.
A professional firm may have:
- good client activity
- late payments
- squeezed margins
- and rising short-term borrowing
A retailer may have:
- decent sales
- too much stock
- thinner margins
- and poor cash conversion
A manufacturing business may have:
- strong order volume
- slow collections
- high inventory holding
- and growing debt
That is why I prefer to talk about financial warning signs in business rather than just formulas.
Financial stress rarely arrives neatly. In many businesses, the pattern is mixed: sales still come in, but cash is late, margins are tighter, receivables are slower, and debt is doing more of the heavy lifting than it should.
Where does ratio analysis go wrong?
Ratio analysis goes wrong when leaders use it mechanically, slowly, or without context.
That is the direct answer.
Why can one “good month” hide a weaker trend?
One good month can hide a weaker trend because trends matter more than temporary relief.
A bounce is not always a recovery. Sometimes it is just a pause in a wider slide.
In my experience, leaders often relax too quickly when one month looks better. The danger is not optimism itself. The danger is optimism without memory.
If the wider pattern is:
- weaker revenue
- slower collections
- thinner margins
- rising debt
then one cheerful month does not erase the direction of travel.
Why do busy teams often confuse activity with health?
Busy teams confuse activity with health because movement feels reassuring.
Lots of leads. Lots of calls. Lots of orders. Lots of noise.
But none of that automatically means strong business financial health ratios.
This is one of the most common behavioural traps I see. Teams mistake motion for strength. Leaders mistake effort for evidence. Everyone feels productive. The numbers quietly disagree.
Why does slow reporting make ratios much less useful?
Slow reporting makes ratios much less useful because a delayed signal is often more expensive to act on.
A ratio that arrives weeks late may still be technically correct, but it is far less useful as a decision signal. If current ratio, gross margin, accounts receivable days, or debt to equity ratio are moving in the wrong direction, you want to know sooner, not after the issue has had time to settle in and redecorate.
This is where better financial dashboards and faster review cycles make such a difference.
Why do leaders misread ratios without context?
Leaders misread ratios without context because numbers do not explain themselves.
A weak ratio may mean one thing in a seasonal business and something else in a steady service firm. A rising debt ratio may be sensible if it supports healthy expansion, but more worrying if it covers recurring operating gaps.
That is one reason strong reference sources emphasise comparison across time, industry context, and peer context rather than isolated interpretation. (investopedia.com)
- Leaders focus on one ratio and ignore the wider pattern
- The team confuses activity with health
- One better month is treated like a full recovery
- Reporting is too slow to support real decisions
- Ratios are read without enough business context
How should leaders actually use these financial signals?
Leaders should use these signals as prompts for better questions, quicker reviews, and earlier action.
That is the direct answer.
Which small set of numbers should you track every week?
Track a short, manageable set of signals you will actually use.
For many businesses, that means:
- cash balance
- revenue trend
- gross profit margin
- accounts receivable days
- debt obligations or repayments
That gives you a practical mix of liquidity ratios, margin view, collection behaviour, and leverage pressure without drowning in data.
What changed, and why?
Ask what changed, not just what happened.
This is where how to interpret financial ratios becomes much more useful than simply calculating them.
Look for:
- pricing changes
- customer mix shifts
- rising input costs
- sales-process drift
- weaker payment behaviour
- operational inefficiency
- slower stock movement
- more reliance on borrowing
This is where behavioural insight applied to business becomes especially useful. People often treat the number as the event. But the number is usually the signal. The real work is understanding what sits behind it.
What small action should you take before the problem gets bigger?
Take the smallest useful action early, while you still have room to choose.
That might mean:
- tightening credit control
- reviewing pricing
- cutting non-essential spend
- rechecking sales assumptions
- speaking to lenders early
- clearing slow-moving stock
- reviewing customer quality
- improving reporting speed
This connects closely to how I think about decisions more broadly in the KrisLai Decision Framework™. Better decisions come from understanding behaviour, signals, environment, and consequences. A weak ratio is not the final answer. It is the start of a better question.
How are AI and faster search changing financial judgement?
AI and faster search are making it easier to find explanations and spot patterns, but they do not replace leadership judgement.
That is the direct answer.
How can AI help leaders spot patterns faster?
AI can help leaders:
- summarise trends
- highlight anomalies
- speed up review cycles
- surface weaker patterns in receivables, margin, or cash
- and make financial ratios explained more accessible to non-specialists
That is useful, especially when teams are short on time.
Why do leaders still need judgement, not just dashboards?
Leaders still need judgement because the tool does not decide what matters most, what trade-off is acceptable, or what consequence is worth risking.
A dashboard can show movement. It cannot carry responsibility for the decision.
Over time, I’ve found that good decisions rarely come from data alone. They come from understanding people, reading signals, creating the right environment, and thinking beyond the immediate outcome.
Why do clear answers matter more in an AI-shaped search world?
Clear answers matter more because leaders now search differently. They ask direct questions. They expect quicker, more specific guidance. They do not want a lecture on financial ratios meaning if what they really need is help deciding whether the business is drifting into trouble.
That is why this article is built around direct questions, practical answers, and real-world consequences. It also links naturally to my article on how AI is changing search behaviour.
What you should actually do
Start with five signals and one discipline: review them regularly and act before the pressure becomes expensive.
That is the practical answer.
- Track five signals weekly
Cash, revenue trend, margin, receivables, debt. - Compare trends, not snapshots
One month is not the full story. - Interpret ratios together, not alone
Patterns matter more than isolated figures. - Investigate changes early
Ask what changed, why it changed, and what it suggests. - Act while you still have options
Small fixes are usually cheaper than late rescues.
This approach is part of the KrisLai Decision Framework, a practical method for improving business decisions. The point is not to create perfect forecasting. It is to make better calls sooner.
Financial signals become useful when they change what you do. If a ratio moves in the wrong direction, ask what changed, what it means, and what small action now would prevent a bigger problem later.
Conclusion and Final Thoughts
Financial trouble usually gives warning signs long before it becomes a crisis.
That is the main point.
The most useful key financial ratios and financial signals do not exist to impress anyone. They exist to help leaders see pressure early, understand what the numbers are really saying, and act before the business loses room to choose well.
If you remember nothing else, remember this:
Start with this one thing: track a small set of financial signals every week and ask what changed, not just what happened.
That single habit will do more for real-world execution than a thick pack of late reports nobody really uses.
Financial ratios matter most when they are treated as early warning signals, not finance trivia. Smart leaders read the pattern, ask what changed, and act while the fix is still small enough to manage well.
Financial signals make more sense when you connect them to cash, timing, dashboards, and better business judgement. These related articles are a good next step.
Want a simple, practical guide to making better business decisions under uncertainty?
Enter your email below and I’ll send you the free KrisLai Decision Framework™ guide, built around behaviour, signals, environment, and consequences.
This guide is designed to help leaders think more clearly, act earlier, and make better decisions in the real world.
Frequently Asked Questions
What are financial ratios?
Financial ratios are comparisons between figures in the financial statements. They help show liquidity, profitability, efficiency, and debt pressure more clearly than raw numbers on their own.
What is ratio analysis?
Ratio analysis is the process of using financial ratios to assess a business’s performance, financial health, efficiency, and risk by comparing figures from the financial statements.
What are the most important financial ratios?
The most important financial ratios depend on context, but leaders often benefit from watching cash-related measures, margin ratios, receivables timing, and debt pressure rather than trying to track everything at once.
Why are financial ratios useful for business leaders?
Financial ratios help business leaders spot warning signs early, understand what is changing in the business, and make better decisions before pressure turns into a bigger problem.
Can one financial ratio tell you the full story?
No. One financial ratio on its own rarely tells the full story. Ratios are most useful when compared over time, interpreted together, and read in the context of the business model and current situation.
This article is based on practical experience, independent research, analysis and synthesis.
If you enjoy exploring the ideas behind better business decisions, you may find the Business Thinking Hub useful.
About the author
Kris Lai is a business operator and managing director with experience in land and building surveying, facilities management, logistics, and service delivery.
Earlier in his career, he worked as a Search Engine Evaluator (via Lionbridge, supporting Google), where he assessed search result relevance, user intent, and content quality using structured evaluation frameworks. This experience gives him a rare, practical understanding of how search systems interpret signals and make ranking decisions.
In parallel, whilst working with a charity organisation, he has delivered 1000’s of structured presentations in English, Finnish, and Chinese to audiences ranging from small groups to more than 600 people, and has spent decades mentoring and developing others. This experience informs his approach to clarity, communication, and decision-making under pressure.
He writes about AI, search behaviour, business strategy, and decision-making from a practical, real-world perspective.
👉 Explore ideas connected to better business decisions:
- How AI Is Changing Search Behaviour (And What Businesses Must Do Now)

- Decision-Making Framework Examples: The KrisLai Method in Action
- The KrisLai Decision Framework: A Better Way to Make Business Decisions
- Micro vs Macro Marketing: When to Target Broad Audiences vs Niche Customers
- Customer Intent Marketing: How to Turn Buying Signals Into Sales